I have been wanting to make this post for a long time but I have been simply swamped. We got 1.5" of rain (what a blessing!) so I'm using it as an excuse to make this post even though I've got plenty of other things to be doing. I feel that failing to understand market structure is my greatest weakness in marketing right now. Second to that is probably my poor understanding of the various formations I should be studying. What I think I know about market structure: 1. Structure is referring to pivots on a chart that are more significant than other pivots because the structural pivot represents a confirmation that price has the energy to go further in the direction it's going. If that structural level is broken, something has changed and you really need to be paying attention. 2. In a bull market, after a temporary high, you will have a temporary low. If the initial temporary high is exceeded by the next high, it confirms the temporary low as structural 3. In a bear market, after a temporary low, you will have a temporary high. If the next low is lower than the initial low, it confirms the temporary high as structural. 4. If you are speculating rather than hedging, market structure is a good place to put your stops. This prevents your stops from being washed in minor moves 5. Market structure needs to be viewed from the standpoint of like sized moves. There is market structure in a 1 minute chart just like there is market structure in a 1 month chart. Therefore market structure must be taken in context Since just about everyone on here is affected by the price of corn, I think I'll use that to illustrate the way I interpret structure. Starting with a weekly chart I believe reveals a problem I believe: 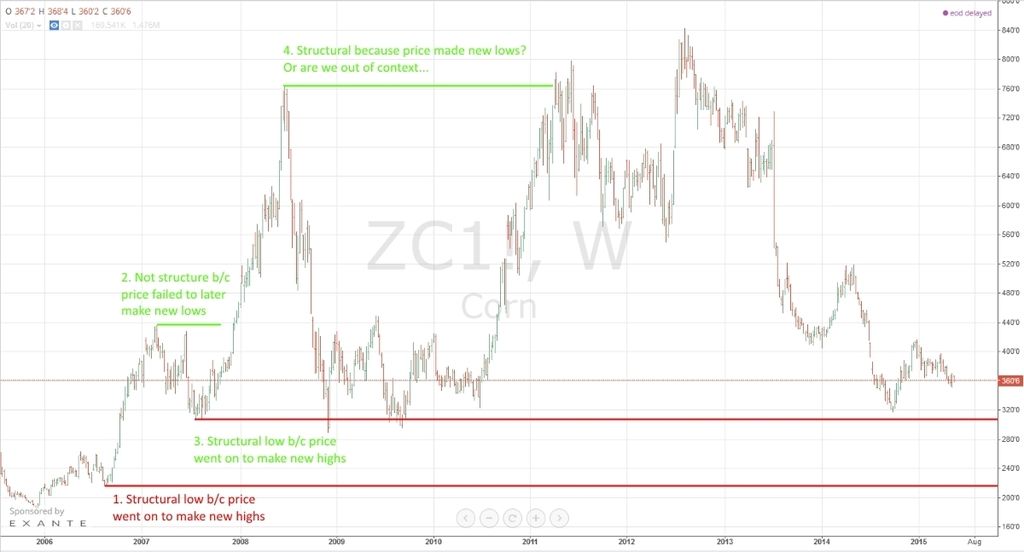
The weekly chart is too busy (I think) for this time frame. To me that is one of the clearest signs of perhaps taking charting out of context is having too much data on the chart. So I switched to the monthly view: 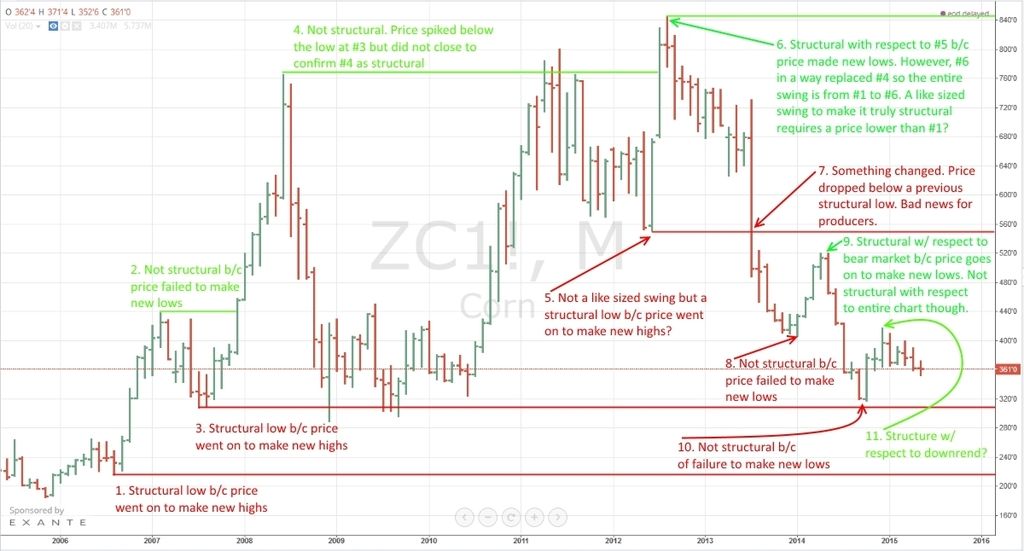
I think my biggest questions are in regards to 5, 6, 9 and 11. Do I have them pegged correctly? I welcome any and all thoughts on this matter. I think my lack of understanding here has been a significant stumbling block. Thanks. |  Lines are cool, but market structure rules

