|

South Central Iowa | First of all, I sinned. I trespassed. Sorry. But none of you know.
I went on a little crop tour. I covered 5 counties in WC/SW Iowa. They were Adair, Adams, Audubon, Cass, and Union. I thought they might be fairly representative of the state as a whole. The area has been mildly dry and possesses middling soils for the state.
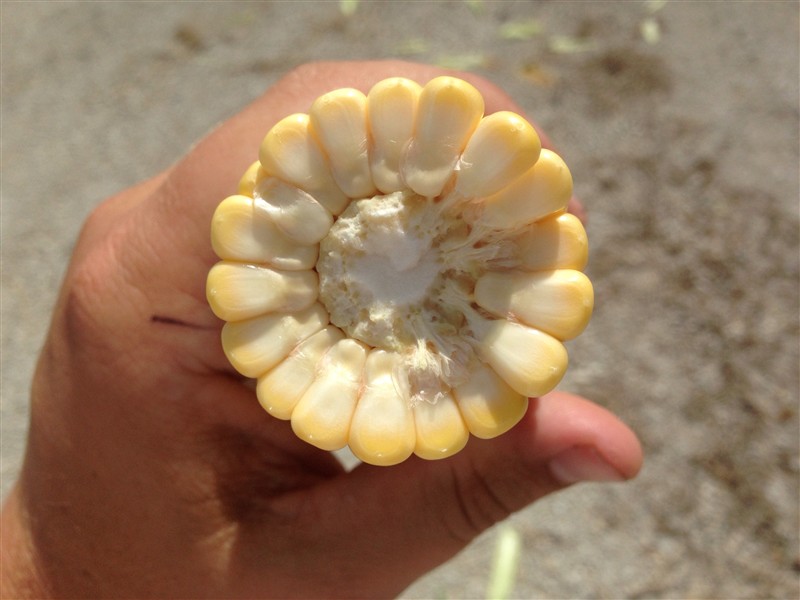
I thought the crop conditions were good. The corn is not the healthiest, darkest green color. There appeared to be some intra-field variation as well. Overall though, the corn appeared average. The most common stage was milk, and about the same amount in silk and blister as in dough. I found no beginning dent yet. Tip-back was common, but not overly severe. Most fields had areas showing some stress on the lower leaves. I saw very little rolling and no fields that were fully rolled or overly short.
My methodology is to measure off 30 feet. I count the number of plants with ears. I then close my eyes and pull a random ear every two paces for five ears. I then count the viable kernels and average the five ears. I multiply that number by 580 for 30" rows and 871 for 20" rows. I then divide by my number of kernels per bushel. For this I used 90,000.
I sampled 21 fields and came up with an average yield of 182.8 bpa and a median of 181.8. The high was 225.7 and the low was 136.6. There were 5 fields that were below 170, 7 fields above 200, and 9 in between. So there is a great deal of inter-field variability.
Using a simple average of those 5 counties, I have average yields over recent years. The 182.8 would be about 10 bushel below 2016, which was 192.4. It is similar to the averages for 2015 and 2014, but significantly above 2013. Those simple averages were 179.0, 175.0, and 148.0 respectively. The 3 year simple average for those five counties is 182.1, nearly identical to my average of 182.8.
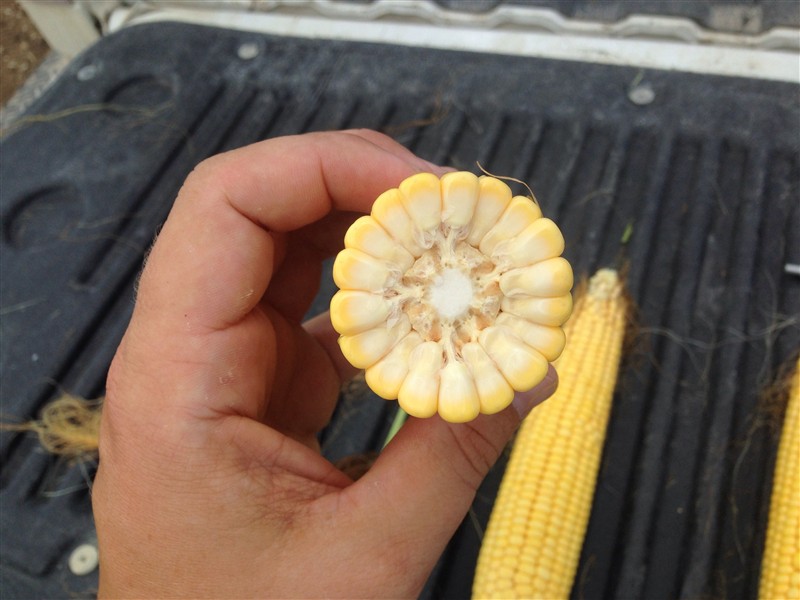
Below are pictures. The first is the drought monitor with the counties outlined. The rest show fields and corn I pulled. The soybeans look pretty good too. The picture with the 3 ears (I ate the other two) shows some poorer pollination, it was estimated at 164.0. I don't have pictures of every ear. Also, I really dig the town of Anita's sign. It's a bear holding a whale... In the middle of Iowa... You definitely notice it, LOL!
Edited by Conan the Farmer 7/30/2017 14:28
 (IOWA DROUGHT.png) (IOWA DROUGHT.png)
 (image.jpg) (image.jpg)
 (image.jpg) (image.jpg)
 (image.jpg) (image.jpg)
 (image.jpg) (image.jpg)
 (image.jpg) (image.jpg)
 (image.jpg) (image.jpg)
 (image.jpg) (image.jpg)
 (image.jpg) (image.jpg)
 (image.jpg) (image.jpg)
 (image.jpg) (image.jpg)
 (image.jpg) (image.jpg)
 (image.jpg) (image.jpg)
 (image.jpg) (image.jpg)
 (image.jpg) (image.jpg)
 (image.jpg) (image.jpg)
 (image.jpg) (image.jpg)
 (image.jpg) (image.jpg)
 (image.jpg) (image.jpg)
Attachments
----------------
 IOWA DROUGHT.png (100KB - 424 downloads) IOWA DROUGHT.png (100KB - 424 downloads)
image.jpg (150KB - 342 downloads)
image.jpg (97KB - 296 downloads)
image.jpg (128KB - 303 downloads)
image.jpg (76KB - 403 downloads)
image.jpg (132KB - 331 downloads)
image.jpg (166KB - 299 downloads)
image.jpg (137KB - 318 downloads)
image.jpg (137KB - 341 downloads)
image.jpg (129KB - 294 downloads)
image.jpg (87KB - 278 downloads)
image.jpg (192KB - 351 downloads)
image.jpg (159KB - 317 downloads)
image.jpg (108KB - 262 downloads)
image.jpg (198KB - 335 downloads)
image.jpg (177KB - 259 downloads)
image.jpg (137KB - 320 downloads)
image.jpg (104KB - 381 downloads)
image.jpg (151KB - 291 downloads)
| |
|
 Mini Crop Tour - WC/SW Iowa and Yield

