| farnerbob - 7/9/2012 17:59
...... so where does 2012 corn look like it will end up according to Andrews?
Hi Farnerbob,
I can't speak for the late great Dr., but fortunately he left his hard work behind for us to use. Dr. Andrews stated that there is an high probability (around 80%) that when price leaves one median line, its traveling to the next, and or an extension of the median line. That means that at some point in the future, we should get to the upper median line (UML) on this chart. If/when price reached the UML, we will be watching closely for clues as to whether we are going to continue on to WL1, or....... I am sure that some market gurus got hard statistics on the odds of attaining WL1, unfortunately, I don't, so I will let price tell me.
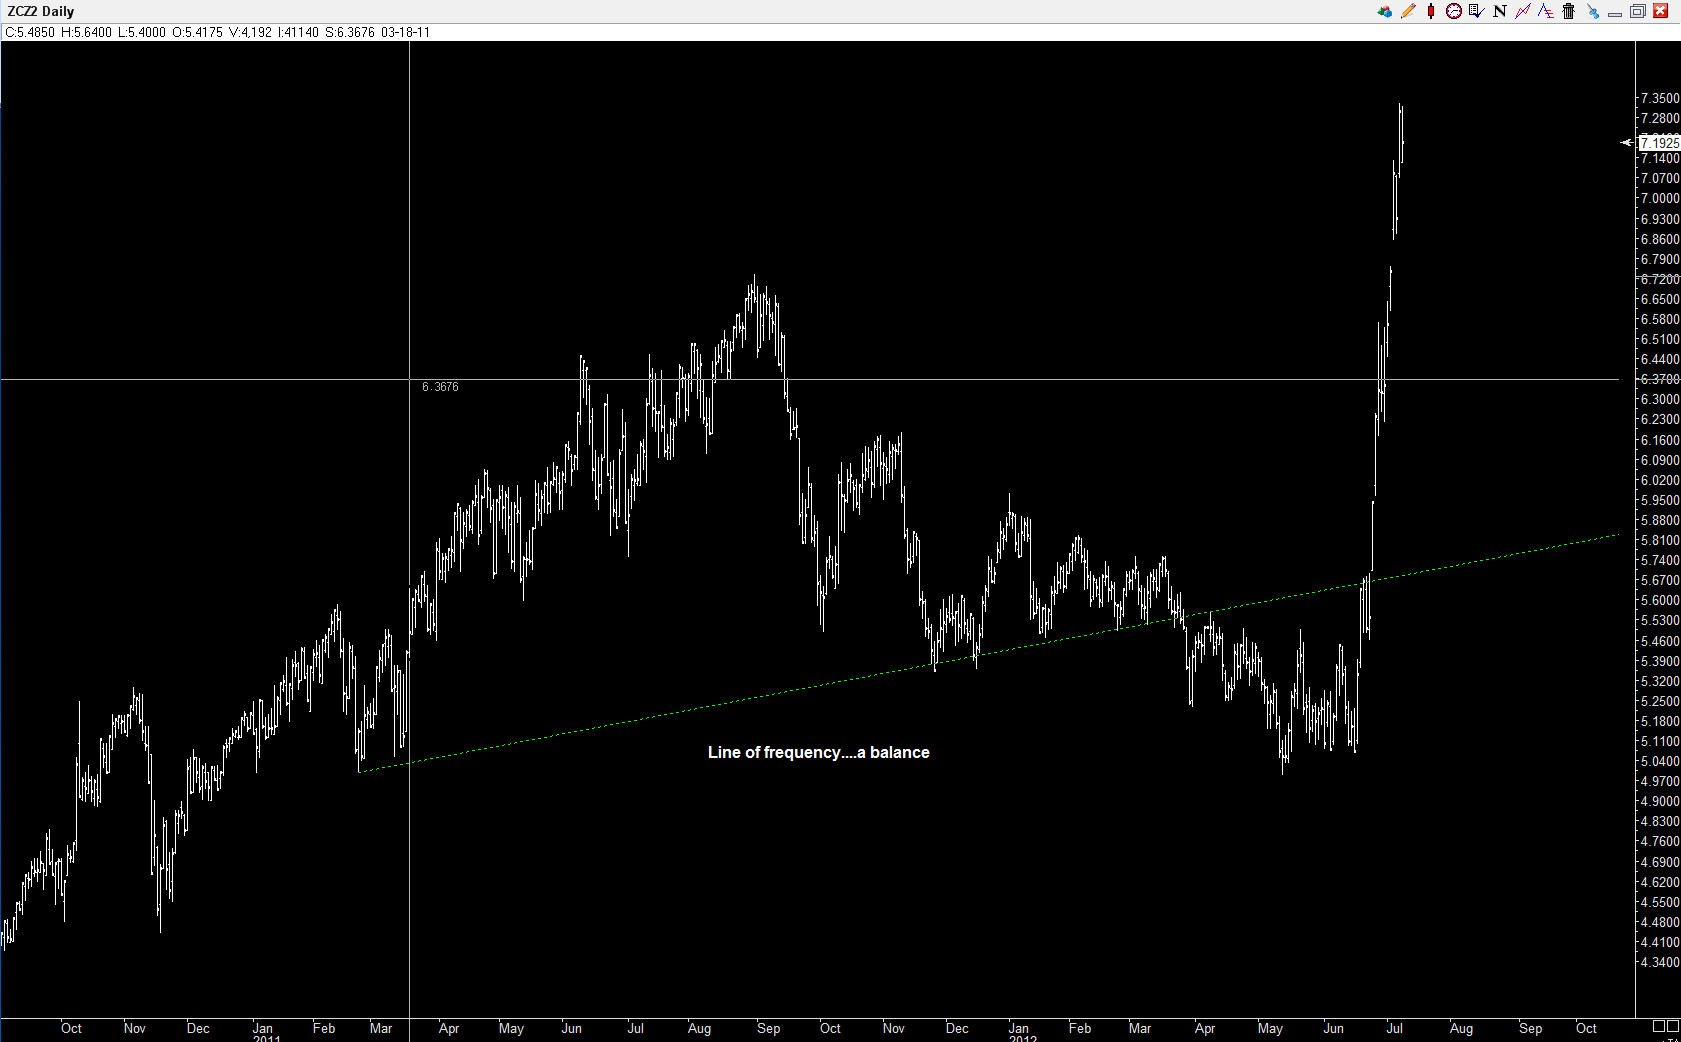
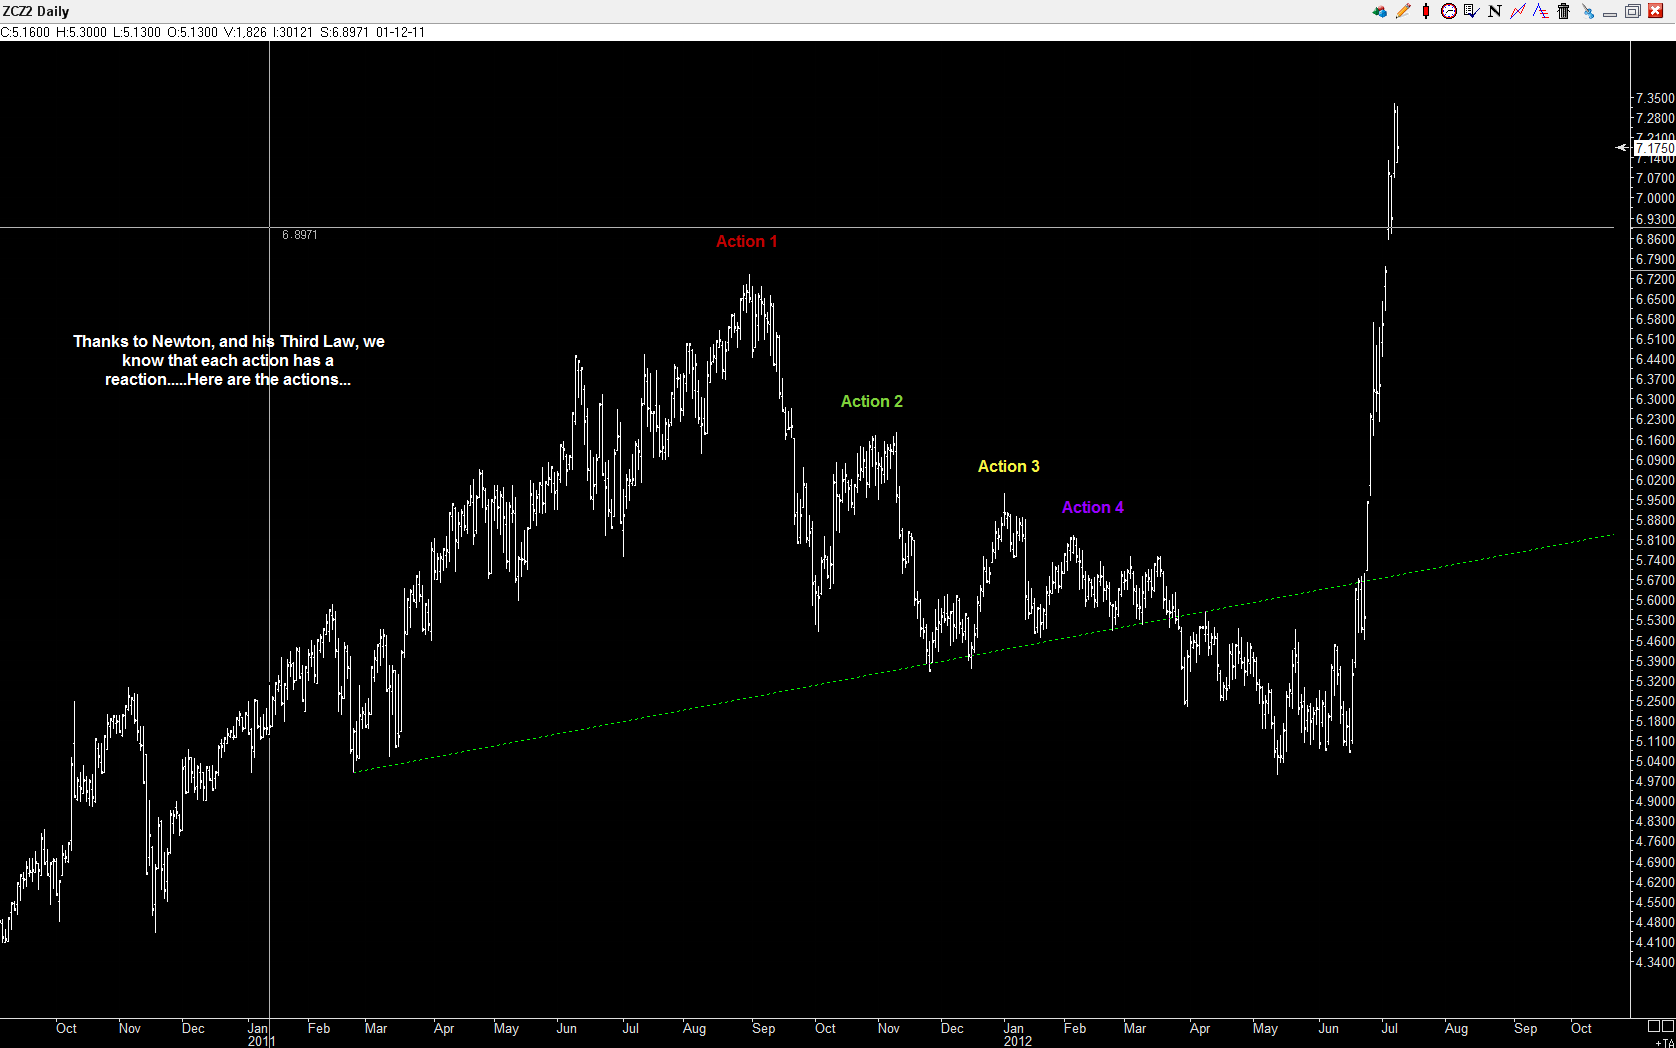
What else do we know about corn?....Like I posted last night, we have reached an the point where price ran out of energy the last time up, based on the frequency of the chart. Tough thing to possibly get your head around, so I will try and break it down a bit. Thanks so Sir Isaac Newton's third law, we know that each action has an opposite reaction. Just like it takes energy (force) to move an object physically, it also takes energy to move the market....they are one in the same. Dr. Andrews treats A/R sets similiarly to median lines.....the same rules apply. If we can find the frequency, we can project probable turns in the market simply by using his simple laws....No USDA, droughts, no exports...Its all there.. Expressed as energy and expressed as a plot on the chart. Attaching a chart showing some of the AR sets on that chart.. The consistent reaction from the lines gives you great confidence in the frequency that exists in the market....and that we would at least pause here...
We don't know for sure where things are going, but we can use some of this information to get an idea of where we are heading....Let's watch and see...Hope that all makes sense....
Edited by jpartner 7/9/2012 22:21
 (2008 july 9 corn1.jpg) (2008 july 9 corn1.jpg)
 (2008 july 9 corn2.png) (2008 july 9 corn2.png)
 (2008 july 9 corn 3.png) (2008 july 9 corn 3.png)
 (2008 july 9 corn 4.png) (2008 july 9 corn 4.png)
 (2008 july 9 corn 6.png) (2008 july 9 corn 6.png)
 (2008 july 9 corn 7.png) (2008 july 9 corn 7.png)
Attachments
----------------
 2008 july 9 corn1.jpg (37KB - 47 downloads) 2008 july 9 corn1.jpg (37KB - 47 downloads)
2008 july 9 corn2.png (77KB - 45 downloads)
2008 july 9 corn 3.png (60KB - 53 downloads)
2008 july 9 corn 4.png (80KB - 54 downloads)
2008 july 9 corn 6.png (64KB - 43 downloads)
2008 july 9 corn 7.png (79KB - 57 downloads)
|
 Dec, 12 corn....we're back to the stretch

