|
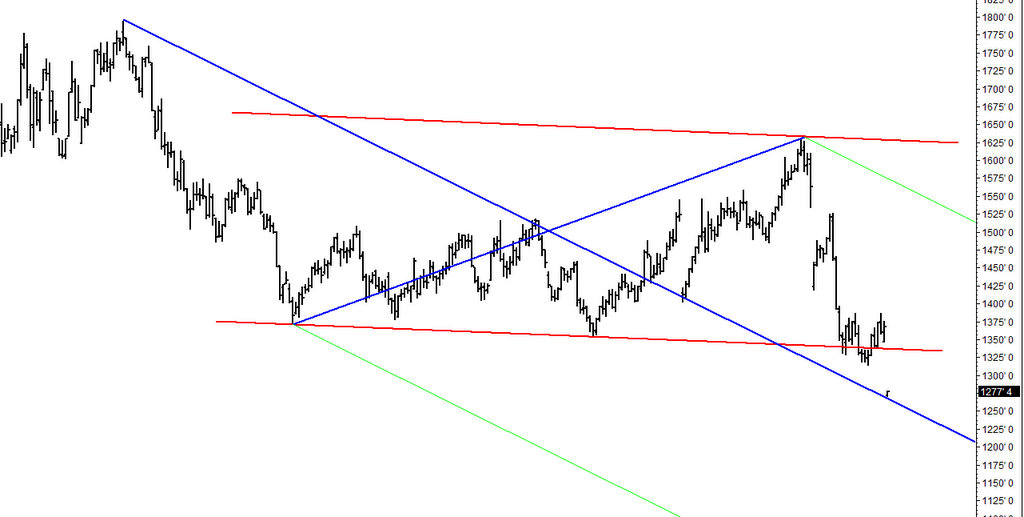
Theodore, Saskatchewan | Always find it fascinating when this happens. Contract expires and it gaps lower right on to a ml on the continuous chart.
Also took another look at the monthly chart with the long uptrend fork on it. Had not looked at it since the winter, because things move fairly slow on the chart, and it behaved really as we expected.
Now when J first started showing me forks on the bean chart over a year ago there was a mod schiff fork and I drew a downslope fork that at the time was just a guess. Does not look good but sure seems to be leading price. If that comes to pass we may have lots of time for fishing!
I am thinking we will get a pricing opportunity soon so hopefully the charts will help us catch it and greed will not stop us from doing what we should.
Edited by maydel 8/14/2013 21:51
 (1-Fullscreen capture 14082013 84642 PM.jpg) (1-Fullscreen capture 14082013 84642 PM.jpg)
 (1-Fullscreen capture 14082013 84705 PM.jpg) (1-Fullscreen capture 14082013 84705 PM.jpg)
 (1-Fullscreen capture 14082013 84738 PM.jpg) (1-Fullscreen capture 14082013 84738 PM.jpg)
Attachments
----------------
 1-Fullscreen capture 14082013 84642 PM.jpg (79KB - 22 downloads) 1-Fullscreen capture 14082013 84642 PM.jpg (79KB - 22 downloads)
1-Fullscreen capture 14082013 84705 PM.jpg (66KB - 23 downloads)
1-Fullscreen capture 14082013 84738 PM.jpg (34KB - 23 downloads)
| |
|
 maydel/fry

