|
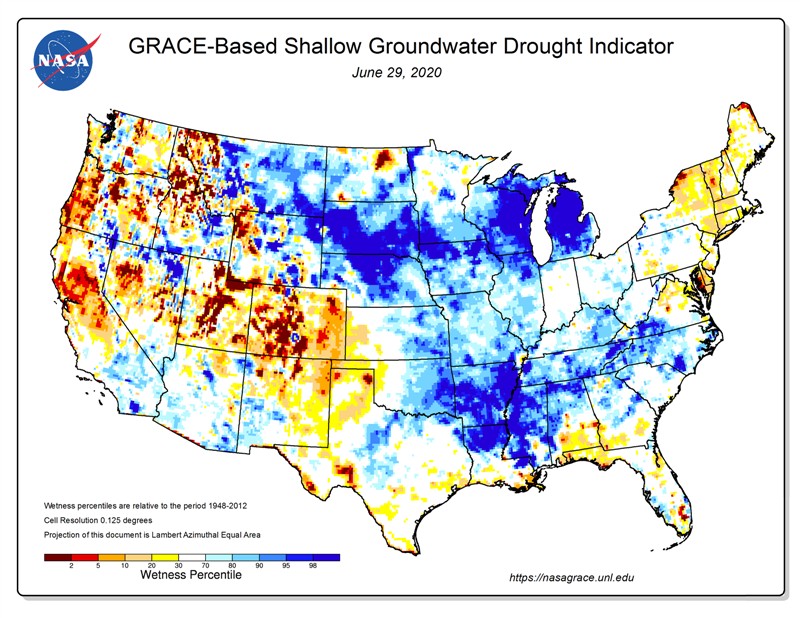
EC SoDak | It’s plenty wet in my immediate area and I’m in the “abnormally dry” area, but also in/near that dark blue spot of the second map on the ECSD/SWMN border. Attached is the current drought map for SoDak and then the root zone and sub moisture maps from NASA, probably helps explain, or confuse, what is going on.
Edited by SoDak Farms 7/2/2020 23:22
 (0EFEBB1E-071B-43DB-9FB8-D4B63FFDC76C (full).jpeg) (0EFEBB1E-071B-43DB-9FB8-D4B63FFDC76C (full).jpeg)
 (9C98BB1D-9F79-450B-BE74-72DA1183E50C (full).png) (9C98BB1D-9F79-450B-BE74-72DA1183E50C (full).png)
 (F8F9AEE7-82E3-4255-BFC1-52939463E927 (full).png) (F8F9AEE7-82E3-4255-BFC1-52939463E927 (full).png)
Attachments
----------------
 0EFEBB1E-071B-43DB-9FB8-D4B63FFDC76C (full).jpeg (72KB - 20 downloads) 0EFEBB1E-071B-43DB-9FB8-D4B63FFDC76C (full).jpeg (72KB - 20 downloads)
9C98BB1D-9F79-450B-BE74-72DA1183E50C (full).png (170KB - 21 downloads)
F8F9AEE7-82E3-4255-BFC1-52939463E927 (full).png (170KB - 21 downloads)
| |
|
 Drought Map Comparison: Last Week of June 2005-2020

