|
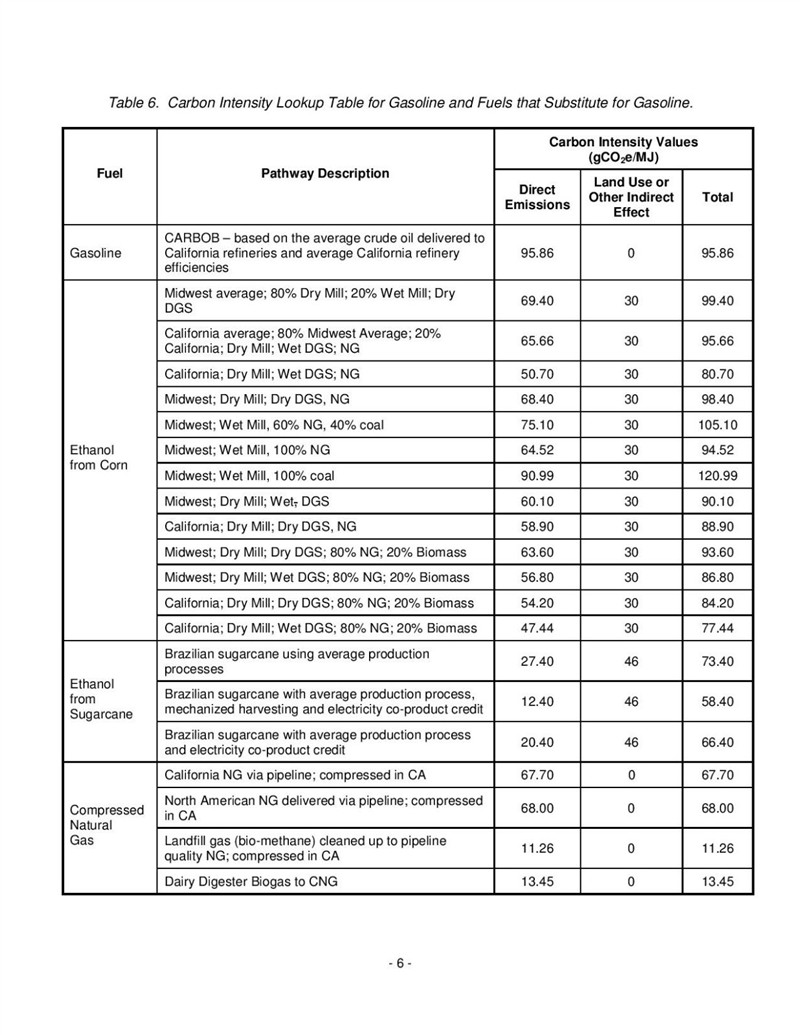
| Below is a table showing the carbon intensity scores for different fuel pathways that California uses to calculate it's low carbon values.
You can see that they have arbitrarily assigned Midwestern ethanol an indirect land use value of 30 which dramatically increases Midwest corn ethanol's score. Without that high land use score, corn ethanol would score much more favorable than gasoline, etc. They are even worse for soybean biodiesel.
I don't completely understand how they arrive at their land use score but supposedly it's based on the idea of what the land would be converted from or back to if the biofuel wasn't needed. I think they are assuming it goes back to grassland or prairie.
 (Carbon intensity scores-page-001 (full).jpg) (Carbon intensity scores-page-001 (full).jpg)
 (Carbon intensity scores-page-002 (full).jpg) (Carbon intensity scores-page-002 (full).jpg)
 (Carbon intensity scores-page-003 (full).jpg) (Carbon intensity scores-page-003 (full).jpg)
 (Carbon intensity scores-page-004 (full).jpg) (Carbon intensity scores-page-004 (full).jpg)
Attachments
----------------
 Carbon intensity scores-page-001 (full).jpg (178KB - 82 downloads) Carbon intensity scores-page-001 (full).jpg (178KB - 82 downloads)
Carbon intensity scores-page-002 (full).jpg (153KB - 83 downloads)
Carbon intensity scores-page-003 (full).jpg (174KB - 83 downloads)
Carbon intensity scores-page-004 (full).jpg (131KB - 72 downloads)
| |
|
 Ethanol update.. Trump Administration yet to act on Waived RINS!!

