|
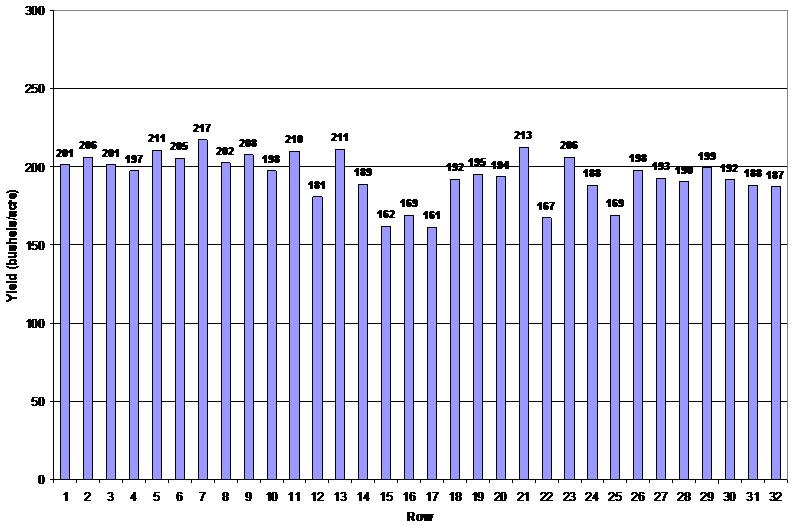
Iowa | Following up on my earlier posts regarding row-by-row yield data, attached is a graph with an example. I have had the opportunity the last two harvests to assist Bob Recker, President and Founder of Cedar Valley Innovations, on working with row-by-row yield data. The following data from 2006 shows (2) 16 row planter passes that were 1/2 mile long and planted with autosteer (I *think* SF2). Anyone care to guess where the "guess" rows are?
http://talk.newagtalk.com/forums/thread-view.asp?tid=64976&mid=4592...
With today's input and crop prices, what is the economic value to systematically trying to eliminate variables which can cause yield reduction (i.e.- implement drift)?
 (Crop yield.JPG) (Crop yield.JPG)
Attachments
----------------
 Crop yield.JPG (76KB - 209 downloads) Crop yield.JPG (76KB - 209 downloads)
| |
|
 Analyzing precision ag technology's effect on crop yield

