
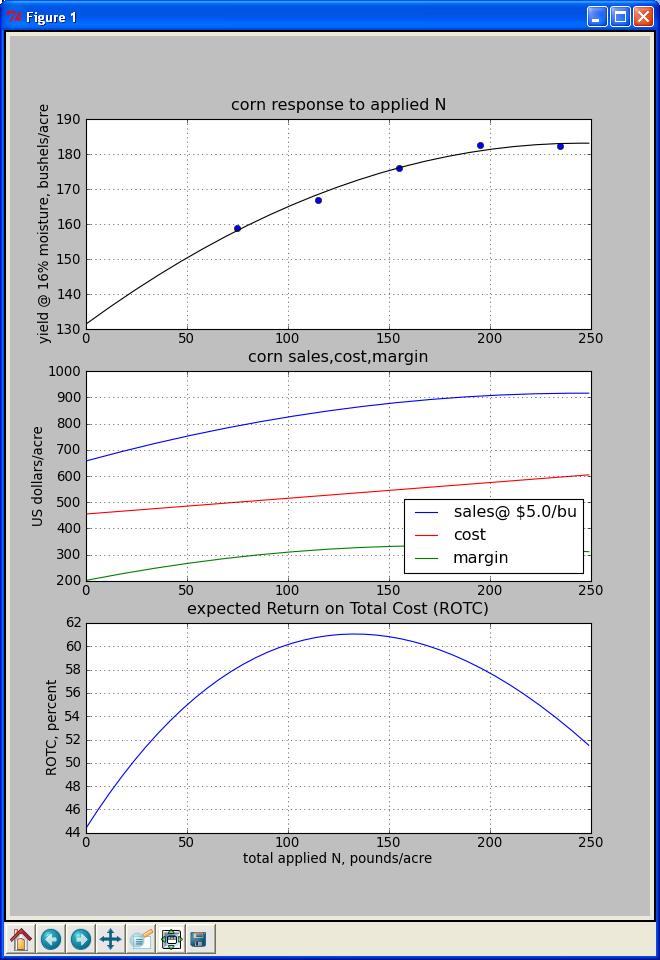
Centre county Pennsylvania, USA | Attached graphs show expected financial performance for N-Rate plot results when:
N_price=0.60 # price payed for N, $/lb
corn_price=5.00 # price received for corn, $/bu
cost_other=455 # all other costs (except N and money), $/acre
costofmoney=.04 # cost of money (fractional)
Notice that ROTC peaks before margin peaks (costs climb faster than margin after ROTC peak)
 (N-rate plot performance.jpg) (N-rate plot performance.jpg)
Attachments
----------------
 N-rate plot performance.jpg (92KB - 33 downloads) N-rate plot performance.jpg (92KB - 33 downloads)
|
 My N-rate plot results

