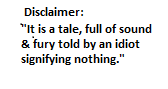
Death comes to us all. Life's but a walking shadow | I just want to bring to your attention the apparent noise in the data. Below is chart showing the EIA's ethanol blended and the finished gasoline supplied numbers plotted together. Close inspection of the chart show some inconsistency. A scatter plot shows some of this as well but also includes the fact that since 2010 the trend has been to blend increasing amounts of ethanol. However, a 4-week rolling ave. really helps to smooth out the relationship between finished gasoline and ethanol blended.
This suggest that however EIA is collecting their data it's not being reported so that there is a strict correlation between the two factors.
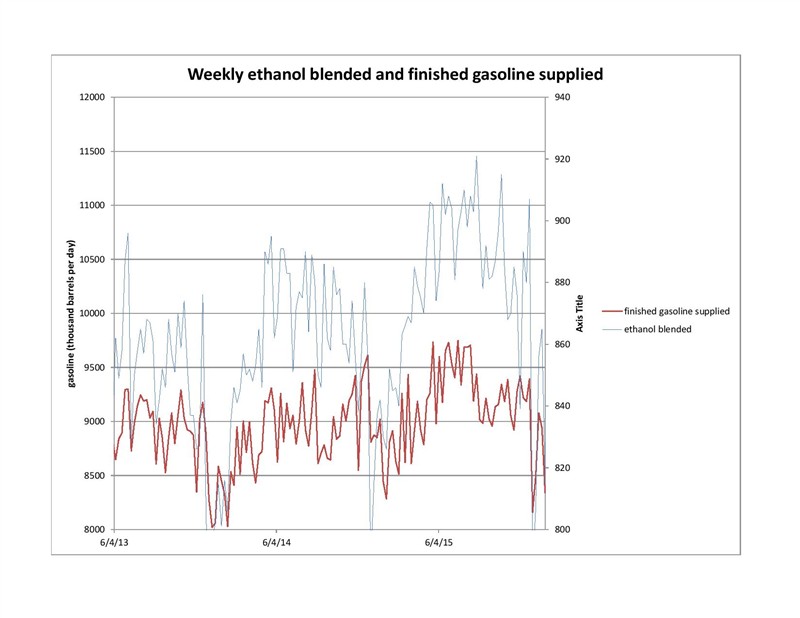 (finhd gas vs ethano blended wkly-page-001.jpg) (finhd gas vs ethano blended wkly-page-001.jpg)
 (scatter gas vs ethanol-page-001.jpg) (scatter gas vs ethanol-page-001.jpg)
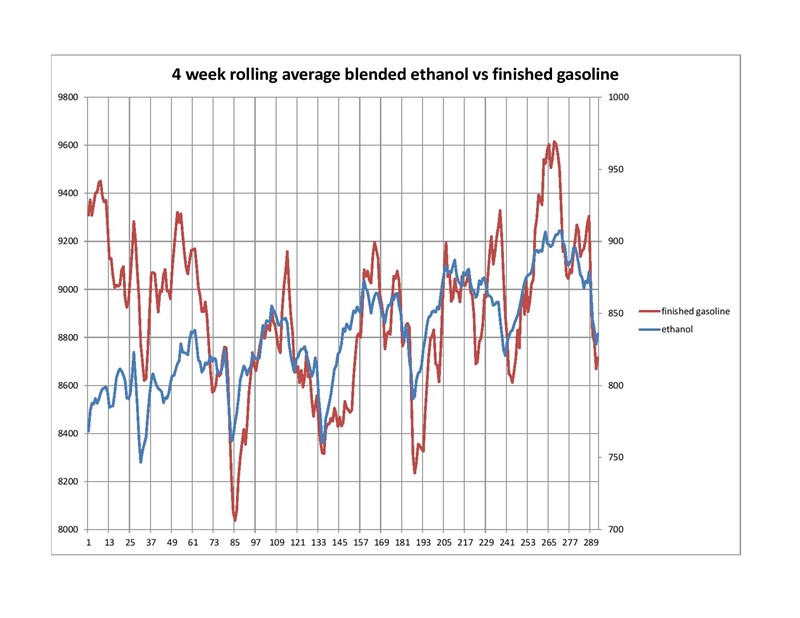 (4wkrollave-page-001.jpg) (4wkrollave-page-001.jpg)
Attachments
----------------
 finhd gas vs ethano blended wkly-page-001.jpg (61KB - 25 downloads) finhd gas vs ethano blended wkly-page-001.jpg (61KB - 25 downloads)
scatter gas vs ethanol-page-001.jpg (68KB - 21 downloads)
4wkrollave-page-001.jpg (83KB - 22 downloads)
|
 Ethanol update.. storm slows gasoline/ethanol usage

