|
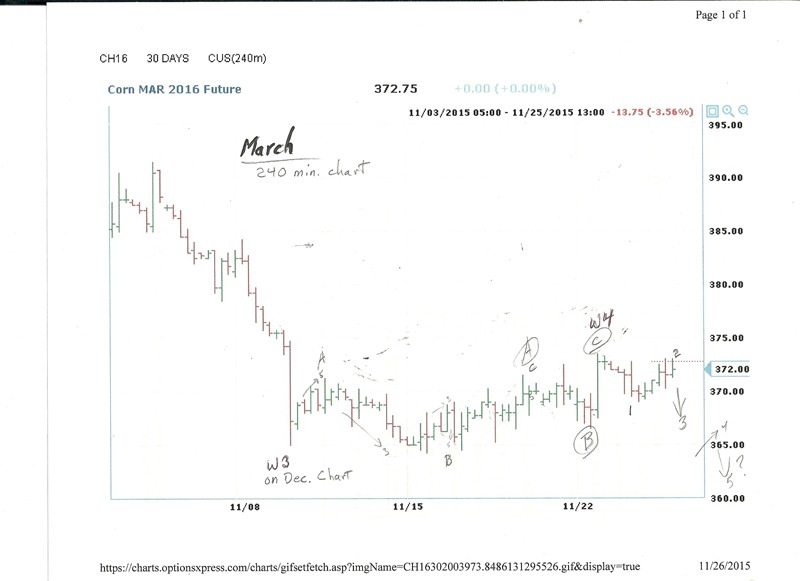
ecpa | This will show the transition to March corn as it takes on a slightly different look. Pic one will show it in the 240 min. chart. I am OK with it but was still uncertain so I then made the 90 min chart to see if it would confirm my thoughts on the 240 min. chart and it has. This will be the last leg down to finish the Large Orange Wave C as noted on previous charts. Once complete we should see some upside potential. As I am a short term trader, this last move down should set me up for a decline to roughly the 360 area. Where will it go in the next couple months? I can only guess at that so I will stick with the short term. I hope some will understand this and be able to see the EW as I apply it. The end of charts.
 (Scan_Pic0012.jpg) (Scan_Pic0012.jpg)
 (Scan_Pic0013.jpg) (Scan_Pic0013.jpg)
Attachments
----------------
 Scan_Pic0012.jpg (50KB - 43 downloads) Scan_Pic0012.jpg (50KB - 43 downloads)
Scan_Pic0013.jpg (59KB - 37 downloads)
| |
|
 From Dec corn to March corn

