|
Jesup, IA | My 86yo father always remarks "the market can't rally until the grain is out of the farmers hands."
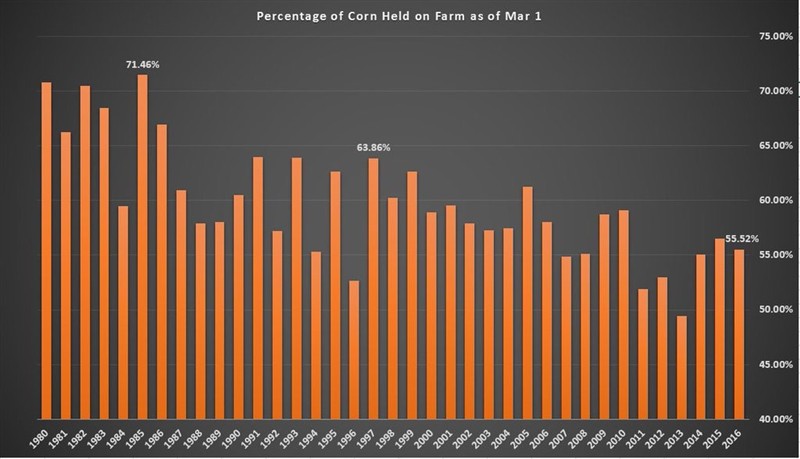
This graph was up on Twitter over the weekend. If it is accurate, it kind of surprised me. First, because after the great bin building spree, that stocks are lower than last year or two years ago in 2014. Second, how much lower stocks are now than our last episode of $3 corn in 2009-2010.
Of course, things are regional. And the ECB vs. the WCB are two different stories. Is this just the ECB's smaller crop showing up? But the reality is "here" in E IA where I was fortunate to have a 2015 crop 25 bu better than my previous best, the truck lines are non-existent and the grain merchandisers actually call and say nice things from time to time to get grain flowing.
Do I dare suggest that maybe, just maybe, last year for as good as it was in the West, got overstated a bit? Or is NASS/USDA always right? Like they were last Thursday with 93.6 mil acres?
Or that a statistic like shown in the graph is why the market did not lock limit down last Thursday on the acreage news?
Useage is growing?
Anybody care to offer an opinion?
Edited by Ben Riensche 4/5/2016 08:30
 (image.jpeg) (image.jpeg)
Attachments
----------------
 image.jpeg (77KB - 67 downloads) image.jpeg (77KB - 67 downloads)
| |
|
 Grain in Farmer's Hands

