"Figure 2 compares the cumulative increase in the general level of prices measured by the CPI, and the Chapwood index — comprised of “the top 500 items on which Americans spend their after-tax dollars in the 50 largest cities in the nation”. The Chapwood price inflation numbers used in the chart are the arithmetic average of the fifty cities, the last data points being end-June 2020. Additionally, the growth of M3 money supply is included." 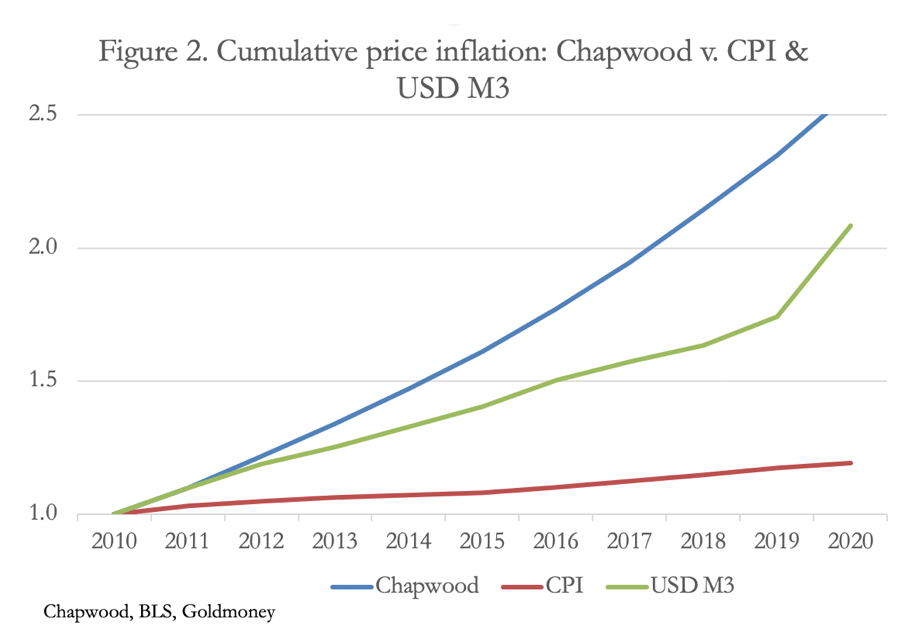
Source article: https://www.zerohedge.com/markets/hyperinflation-here https://chapwoodindex.com/ Running around a 10% average for the last 5 years. I would not agree with the article that hyperinflation is here, but it does bring out some good points about current monetary expansion. John
Edited by John Burns 10/17/2020 07:31
|  Inflation according to Chapwood Index


