
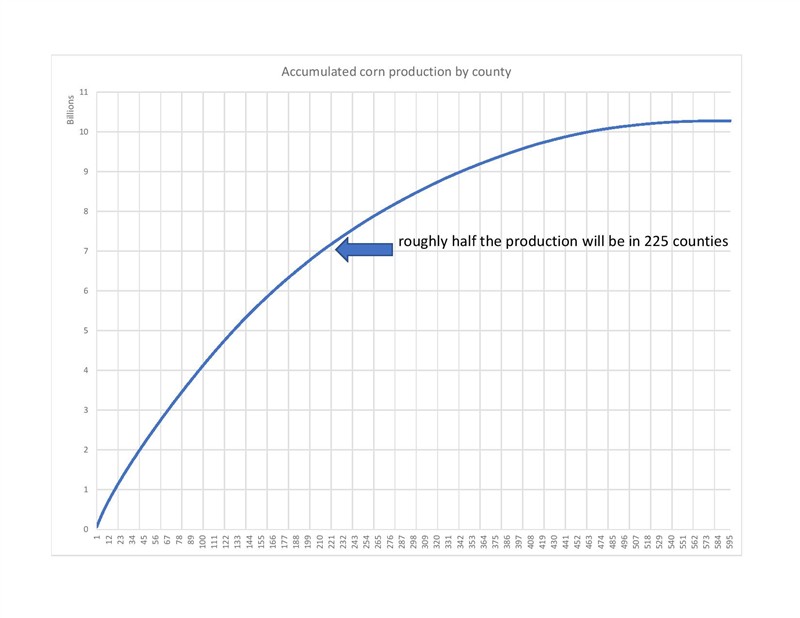
Death comes to us all. Life's but a walking shadow | Where would there need to be significant reduction in corn production in order to possibly affect prices? You might naturally assume that it would need to be in those counties with the greatest production. So where is that?
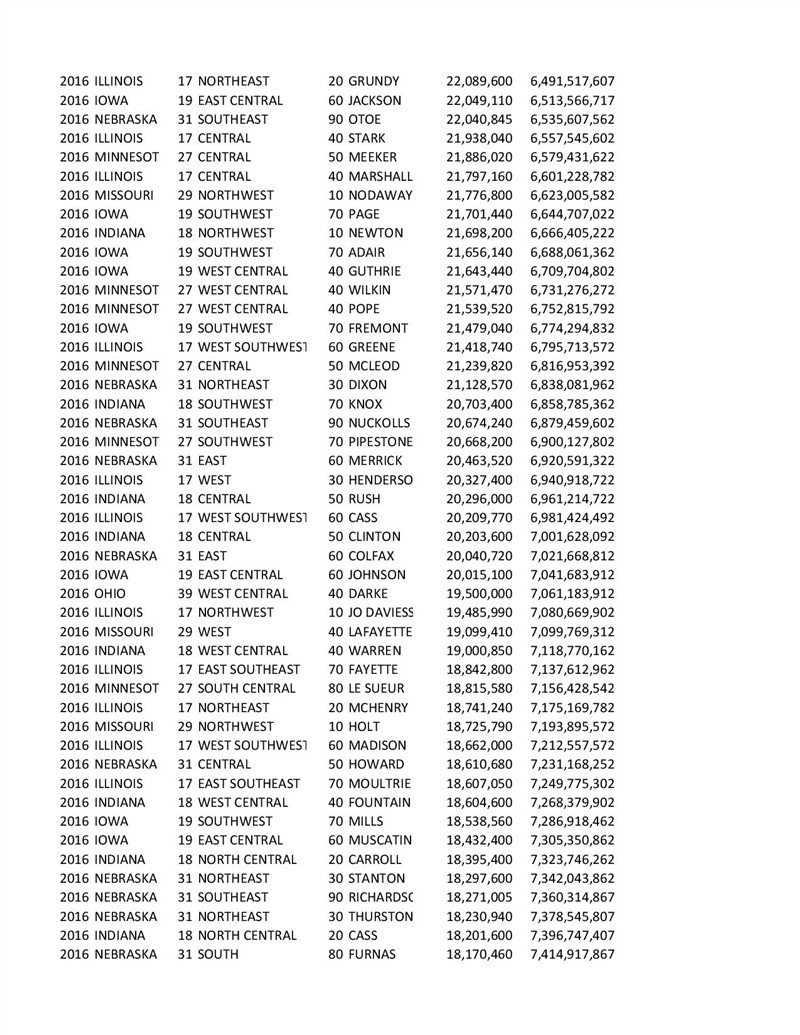
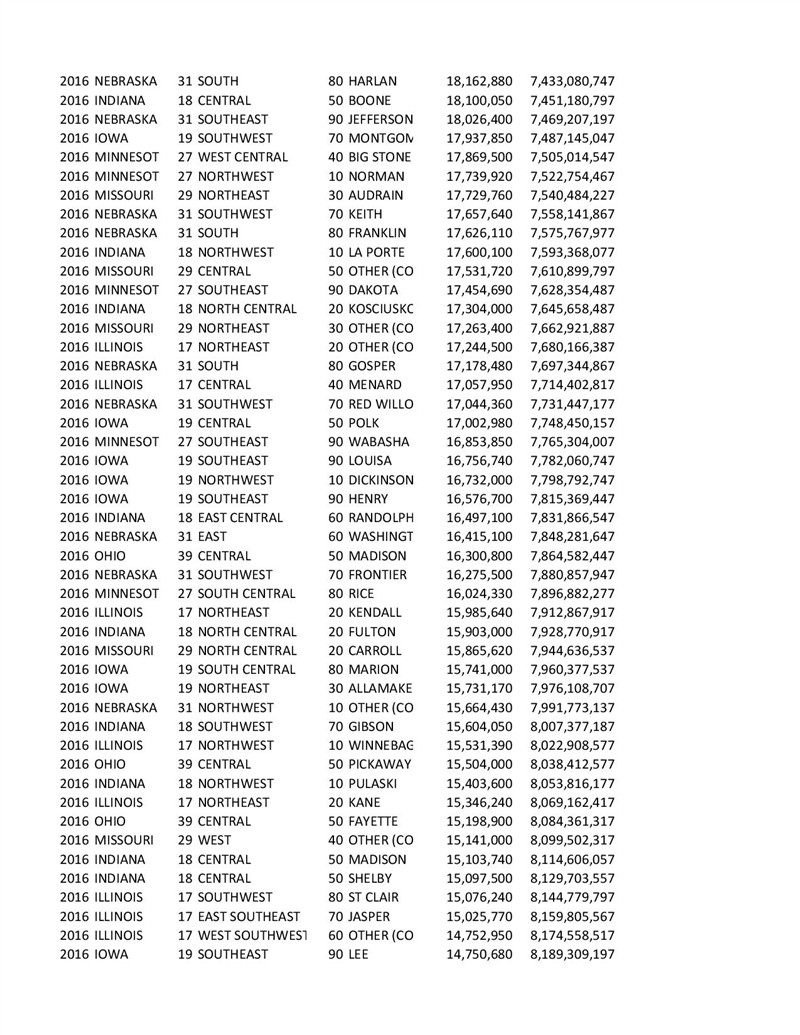
In order to obtain some idea about this, I downloaded the 2016 harvested area and yield for the 596 counties in what we think of as the major corn producing states and ranked them by production from highest to lowest and then calculated the accumulated production. What you see is that these 600 some counties account for almost 11 billion of the 14.5 billion bushels produced last year. The first 240-some counties produced half of all production.
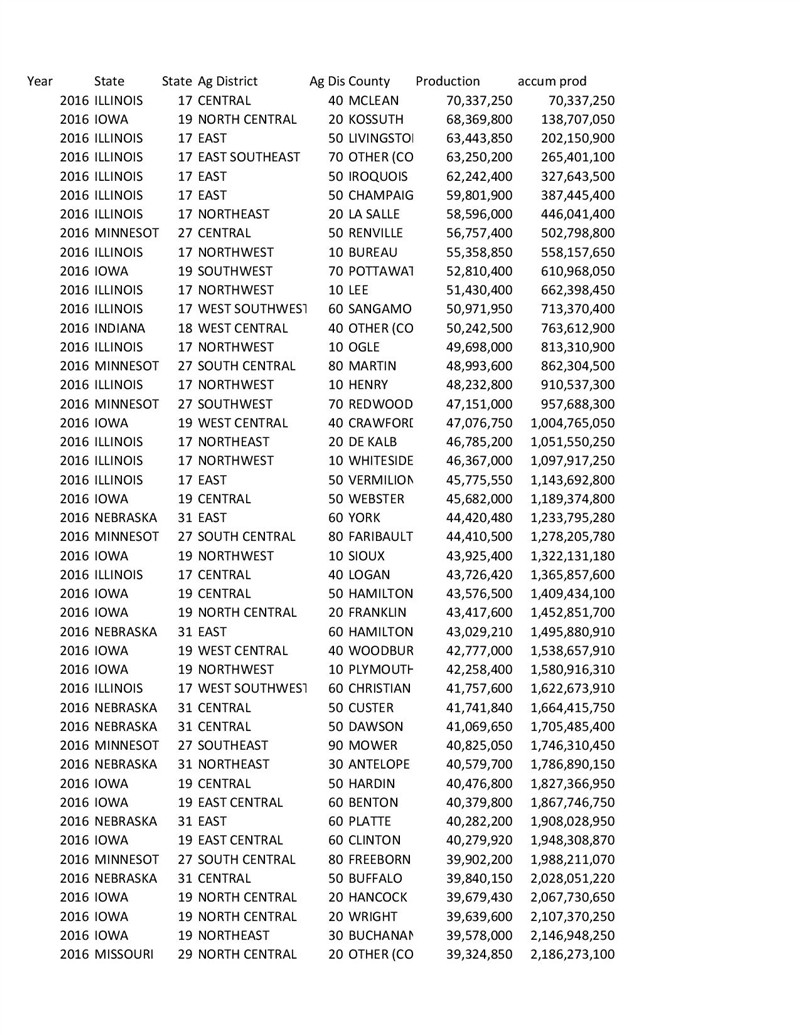
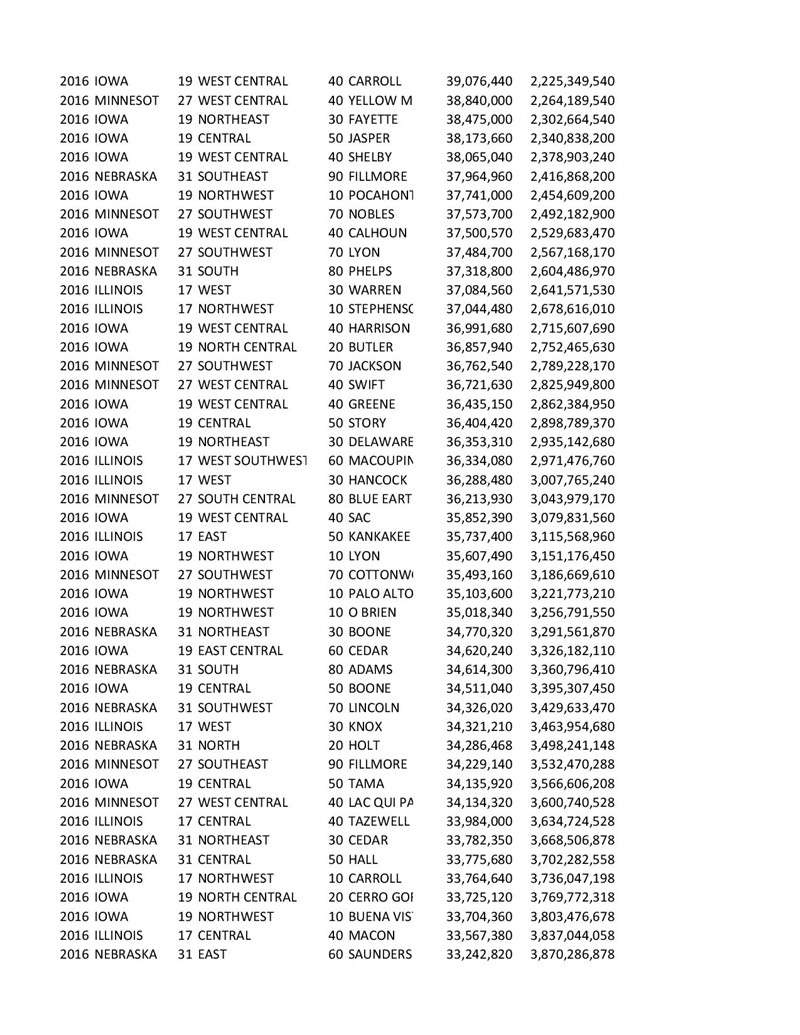
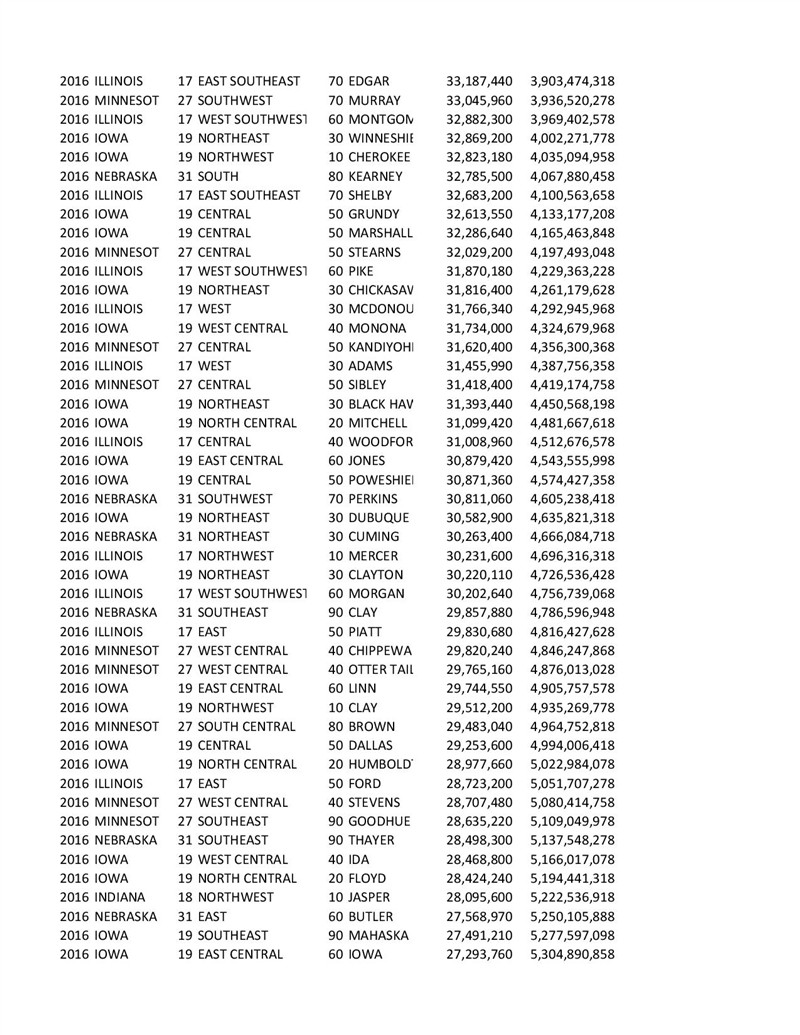
But we kinda of expected that. I then printed off a few pages of the higher producing counties in order to have something available over the next few months to compare with the weather news.
 (Accum corn prod -page-001.jpg) (Accum corn prod -page-001.jpg)
 (corn production by county-page-001.jpg) (corn production by county-page-001.jpg)
 (corn production by county-page-002.jpg) (corn production by county-page-002.jpg)
 (corn production by county-page-003.jpg) (corn production by county-page-003.jpg)
 (corn production by county-page-004.jpg) (corn production by county-page-004.jpg)
 (corn production by county-page-005.jpg) (corn production by county-page-005.jpg)
 (corn production by county-page-006.jpg) (corn production by county-page-006.jpg)
Attachments
----------------
 Accum corn prod -page-001.jpg (61KB - 204 downloads) Accum corn prod -page-001.jpg (61KB - 204 downloads)
corn production by county-page-001.jpg (240KB - 202 downloads)
corn production by county-page-002.jpg (240KB - 229 downloads)
corn production by county-page-003.jpg (240KB - 211 downloads)
corn production by county-page-004.jpg (243KB - 204 downloads)
corn production by county-page-005.jpg (244KB - 198 downloads)
corn production by county-page-006.jpg (242KB - 195 downloads)
|
 Just speculating.

