| I'll bring this updated data to a new thread from our discussion below which some might have missed. The Final FSA numbers are not in yet but thus far per the last update we were down 1.54 myn acres from the initial forecast. Last year the final drop when FSA numbers were accounted for amounted to 2.01 myn acres. So in 2013 we ended up at 95.365 myn acres after an initial NASS forecast for 97.4 myn acres. As others have noted NASS will probably NOT account for this year's FSA Prevented Planted Acres until at least the October report if not the final January report.. However, we know they will EVENTUALLY be accounted for.. thus currently we expect NASS to come in SOMEWHERE AROUND.. 90.1 myn planted acres for 2014 down 5.3 myn acres year over year. Here is my updated table.. note not ALL states are included.. so the numbers do not total at the bottom.. | | | | | | | | | | | | | | | | | | US Crop Acreage | | | | | | | Estimated | | | | | | | NASS | | | Final | Initial | | Initial | | Final | | | | | | | Corn | 2006 | 2011 | 2012 | 2013 | 2013 | PP | 2014 | 2014 | 2014 | 13 - 06 | 14 - 06 | | 2015 | | | | | | | | | | | PP | | | | | | | | AR | 190 | 500 | 710 | 880 | 1,000 | -120 | 580 | -85 | 495 | 690 | 305 | | 485 | | | CO | 1,000 | 1,400 | 1,420 | 1,220 | 1,250 | -30 | 1,170 | -51 | 1,119 | 220 | 119 | | 1,025 | | | IL | 11,300 | 12,500 | 12,800 | 12,000 | 12,200 | -200 | 12,000 | -23 | 11,977 | 700 | 677 | | 12,100 | | | IN | 5,500 | 5,900 | 6,250 | 6,000 | 6,100 | -100 | 6,000 | -15 | 5,985 | 500 | 485 | | 6,100 | | | IA | 12,600 | 14,200 | 14,200 | 13,600 | 14,000 | -400 | 13,600 | -6.7 | 13,593 | 1,000 | 993 | | 14,100 | | | KS | 3,350 | 5,100 | 4,700 | 4,300 | 4,500 | -200 | 4,100 | -46.3 | 4,054 | 950 | 704 | | 3,530 | | | KY | 1,120 | 1,440 | 1,650 | 1,530 | 1,600 | -70 | 1,550 | -8 | 1,542 | 410 | 422 | | 1,535 | | | LA | 300 | 570 | 540 | 680 | 750 | -70 | 420 | -25 | 395 | 380 | 95 | | 400 | | | MI | 2,200 | 2,550 | 2,650 | 2,600 | 2,800 | -200 | 2,550 | -26 | 2,524 | 400 | 324 | | 2,650 | | | MN | 7,300 | 8,100 | 8,750 | 8,600 | 8,700 | -100 | 8,500 | -395 | 8,105 | 1,300 | 805 | | 8,250 | | | MS | 340 | 810 | 820 | 860 | 860 | 0 | 540 | -93 | 447 | 520 | 107 | | 550 | | | MO | 2,700 | 3,250 | 3,600 | 3,350 | 3,450 | -100 | 3,500 | -25 | 3,475 | 650 | 775 | | 3,550 | | | NE | 8,100 | 10,000 | 10,000 | 9,950 | 10,200 | -250 | 9,300 | -9.8 | 9,290 | 1,850 | 1,190 | | 9,750 | | | NY | 950 | 1,040 | 1,170 | 1,200 | 1,250 | -50 | 1,160 | -42.5 | 1,118 | 250 | 168 | | 1,120 | | | NC | 790 | 900 | 860 | 930 | 950 | -20 | 860 | | 860 | 140 | 70 | | 860 | | | ND | 1,690 | 2,300 | 3,600 | 3,850 | 3,900 | -50 | 3,050 | -421 | 2,629 | 2,160 | 939 | | 2,500 | | | OH | 3,150 | 3,500 | 3,900 | 3,900 | 3,950 | -50 | 3,700 | -36.7 | 3,663 | 750 | 513 | | 3,750 | | | PA | 1,350 | 1,400 | 1,460 | 1,480 | 1,500 | -20 | 1,460 | -3.9 | 1,456 | 130 | 106 | | 1,480 | | | SD | 4,500 | 5,200 | 6,150 | 6,200 | 5,900 | 300 | 5,900 | -75 | 5,825 | 1,700 | 1,325 | | 5,500 | | | TX | 1,760 | 1,950 | 1,850 | 2,350 | 2,400 | -50 | 2,100 | -9 | 2,091 | 590 | 331 | | 1,900 | | | WI | 3,650 | 4,150 | 4,350 | 4,100 | 4,200 | -100 | 4,200 | -97 | 4,103 | 450 | 453 | | 4,200 | | | | | | | | | | | | | | | | | | | Total | 78,327 | 92,282 | 97,155 | 95,365 | 97,379 | -2,014 | 91,641 | -1540 | 90,102 | 17,038 | 11,775 | | 86,700 | | Avg Price | $3.04 | $6.25 | $6.89 | 95,400 | 95,400 | 0 | | 90,102 | | | | | | | Total Acreage | 318,610 | 315,143 | 326,320 | 325,600 | | | | | | | | | | | | | | | | -1,790 | | | -5,738 | | -5,263 | | | | -3,402 | | | | 73,840 | 86,760 | 91,430 | 89,580 | | | | | | | | | |
Since prices for 2015 are now LOWER than this time LAST YEAR what can we expect for an acreage reduction for the 2015 crop? As you can see from the table I have penciled in around a 3.4 myn acre reduction for 2015.. and summarize how I get there.. 1234's regression of the ACTUAL DATA is getting some debate which I feel is a very respectable attempt on the subject.. Again here it is.. 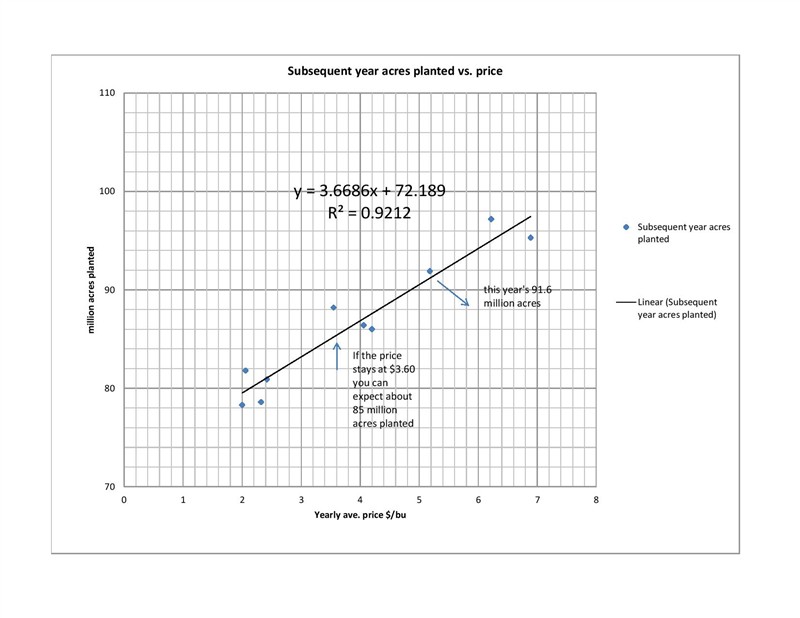
Per his chart and arrow on the intersect lines "If the price stays at $3.60 you can expect 85 myn planted acres." Right above that arrow is a data point where we ACTUALLY DID 88.?? at a 3.5? price.. so my 86.7 splits the difference between his regression line and an Actual data point.. I suspect that point was on the upswing where producers were a little more confident that prices would move higher on the ethanol boom.. I do NOT believe producers will feel that way next year as most think prices will move lower going forward.. Ray J asked me HOW I expect Kansas to respond.. Here is the ACTUAL Planted Acres in Kansas since 1993... | Planted Corn Acreage in Kansas | | | | NASS | | | | | | | | | Dryland | Irrigated | Total | | | | | | | | | | 1993 | | 0.64 | 1.36 | 2.00 | | | 1994 | | 0.81 | 1.49 | 2.30 | | | 1995 | | 0.62 | 1.53 | 2.15 | | | 1996 | | 0.90 | 1.60 | 2.50 | | | 1997 | | 1.10 | 1.65 | 2.75 | | | 1998 | | 1.34 | 1.66 | 3.00 | | | 1999 | | 1.48 | 1.67 | 3.15 | | | 2000 | | 1.74 | 1.71 | 3.45 | | | 2001 | | 1.86 | 1.59 | 3.45 | | | 2002 | | 1.69 | 1.57 | 3.25 | | | 2003 | | 1.46 | 1.44 | 2.90 | | | 2004 | | 1.61 | 1.49 | 3.10 | | | 2005 | | 2.06 | 1.59 | 3.65 | | | 2006 | | 1.99 | 1.36 | 3.35 | | | 2007 | | 2.28 | 1.63 | 3.90 | | | 2008 | | 2.28 | 1.58 | 3.85 | | | 2009 | | 2.49 | 1.62 | 4.10 | | | 2010 | | 3.18 | 1.67 | 4.85 | | | 2011 | | 3.21 | 1.69 | 4.90 | | | 2012 | | 3.09 | 1.61 | 4.70 | | | 2013 | | 2.75 | 1.55 | 4.30 | | | 2014 | | 2.60 | 1.50 | 4.10 | | | 2015 | | | | 3.53 | Jon SCKs |
as well as the chart.. 
As you can see Irrigated Corn production is VERY STABLE.. HOWEVER, DRYLAND has exploded from 0.64 myn acres in 1993 to 3.21 myn acres in 2011.. almost DOUBLE the irrigated acreage. We note that during the LAST expansion and consequent price decline that dryland acres in Kansas fell about 20% To make my GUESSTIMATE work I'm holding irrigated acreage about constant at 1.53 myn which would force dryland acres to right about 2 myn acres.. about what they were back in 2006. I believe although this may be a smidge high of a reduction that 85 bu (or less) yield potential with about 250'ish actual production costs gives you a cash breakeven on Variable production expense right at $3.00.. ZIPPO for the efforts and the Risks.. per my own experience we have seen much lower yields at time.. so a 40% reduction in acres seem pretty reasonable to me...?? Since we have seen a 7 myn acres expansion in corn production since 2006 in the Plains states.. this is where I feel that the bulk of the reduction will come from.. and roughly believe that we will see about half of that acreage revert back to whatever it came from. Similarly I also expect highly productive irrigated cotton ground in the south that has flexed to raising Corn.. last year to cash in on old crop prices.. and Soybean this year.. to beat the bean cliff.. will NOT have as much of a carrot to go after NEXT year.. and consequently will go back to whatever they were planting before.. Cotton or whatever..?? I actually give the cornbelt a bump in acreage as I assume that many flexed to beans this year.. but will flex back to Corn this next year... ?? Still as you can see above I come up with 86.7 myn planted acres... down ANOTHER 3.4 myn acres from this year's expected FINAL number of around 90.1. There it is.. what say you?
Edited by JonSCKs 9/7/2014 17:12
|
 How much do Corn acres fall next year?

