I started to look at charts again this evening. I haven't really looked at them much since I prematurely exited my CZ18 hedges that I had entered at $4.25 or so. I exited them at $3.87 more on a whim than anything and regretted it quite quickly. Last week price made it back up to $3.88 and I re-entered those hedges since I was able to do so without a loss. Once again, I did this on a whim. I just felt like my decision to get out at $3.87 was not well thought out (or really thought out at all) so when I had a chance to get back in without taking a spanking, I did so. One thing I've always struggled with is market structure and I think it's really important to have a good grasp on market structure. I believe it provides the context for everything else that you do with a chart. Since I'm no good at it I figured I would make notes on my charts outlining my thoughts and put them up here for people to discuss. I won't lie, there are a few specific people I'm hoping will comment and set me straight where I am wrong or illuminate things that I may be missing but I'm also not going to be surprised if they do not comment since they seem to get hammered here pretty often. For what it's worth, even though I now favor technical analysis, I enjoy hearing from those of you who favor fundamental analysis. I really like hearing the guys who talk about expected yields, acres and demand and how it will affect carryout and their opinion on how it will affect price. I also enjoy those who have a good handle on the spreads, basis, etc. I haven't enjoyed the politics much recently. I know if you have a fundamental perspective it's hard to separate the two but it just seems like it's been even less friendly than usual around here recently. I miss the conversations on spreads, basis, carryout and especially chart analysis and am just flat out tired of all of the politics injected into market talk. So I guess that's another reason I'm posting and exposing myself to a roasting. I like the part of market talk where we try to learn from one another. So without further delay, here we go. The first thing I struggle with is the extreme basics. How far out do you need to zoom on a chart? As seen below I started second guessing myself this evening right away: 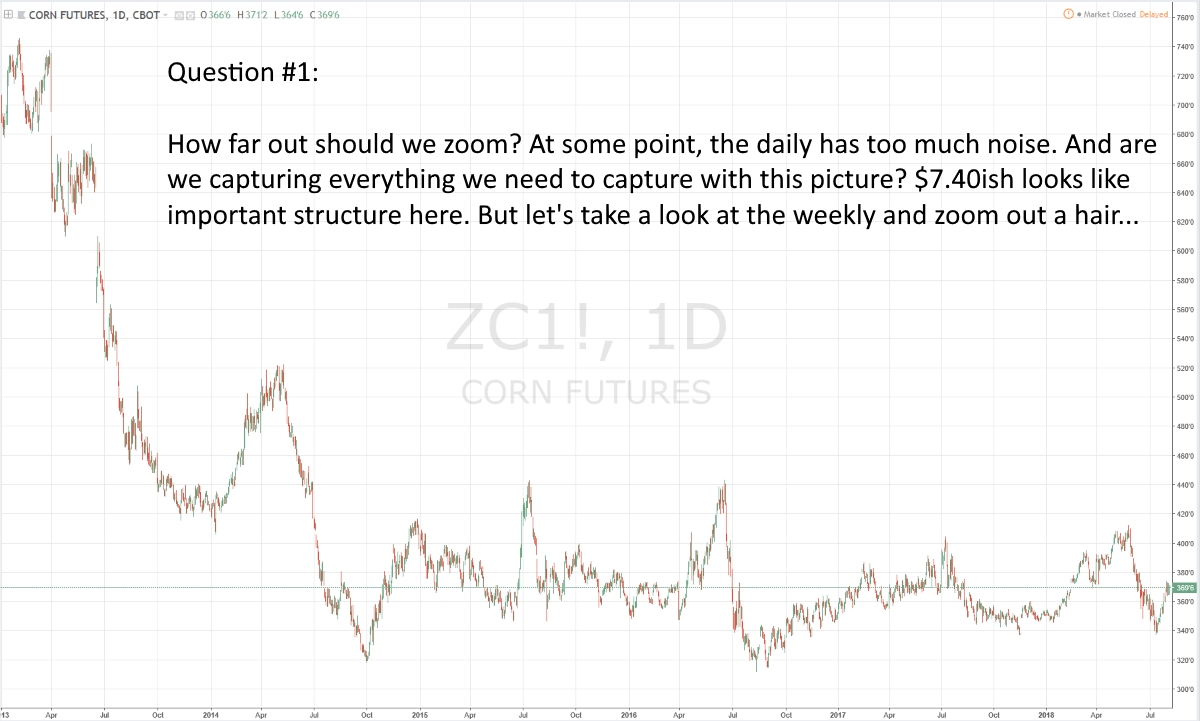
On the next chart below I have zoomed out a little and switched to the weekly. One thing I did not cover in the picture is the following question: What is the definition of a structural seller? I think a structural seller causes prices to make new lows. So why aren't the sellers at $7.60 structural sellers? There was a brief little rally there and the buyers pushed price back up to $7.60 or so and then the sellers at $7.60 pushed it back down again. Lots of other little blips like that. I guess I don't know how to define it but I think structural sellers make major things happen on the chart. Taken in context, the sellers at $7.60 seem like small fries (even though they may be the same sellers that were at $8.50 and they're just defending their position). I guess I would like a more specific definition of structural sellers and structural buyers. A clean definition that I can remember and will guide me through any questions about whether I'm looking at structure or not. 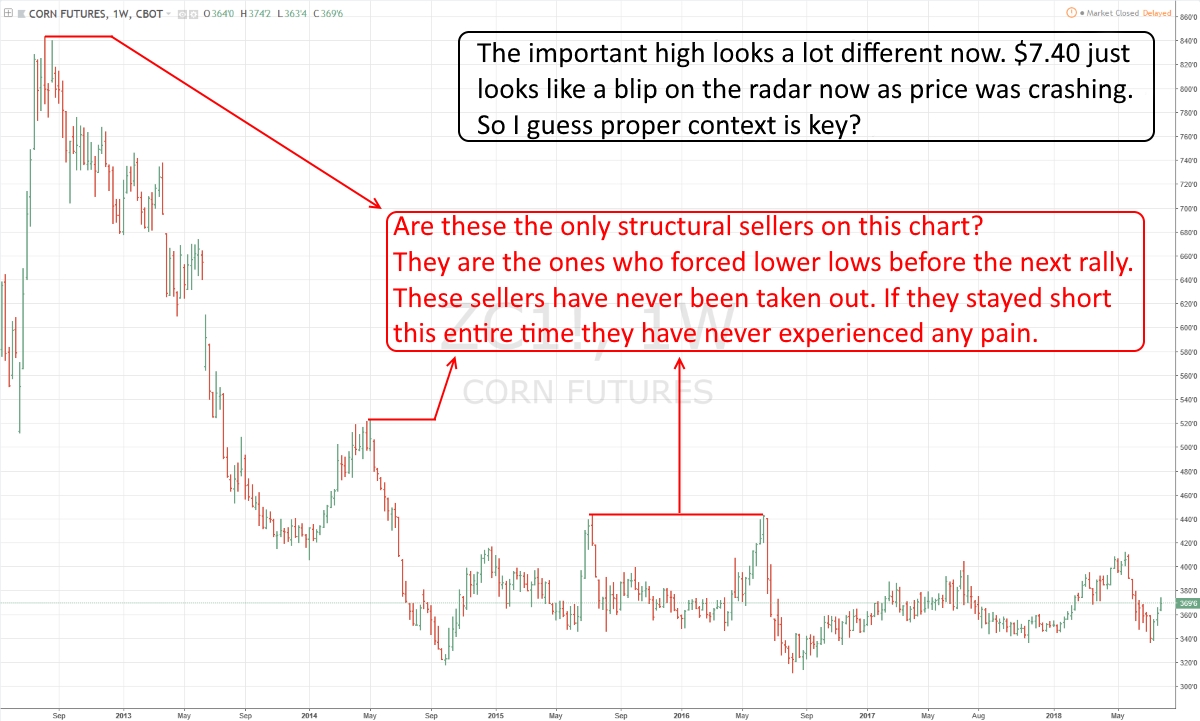
One question I have on the above chart is are the sellers at $4.40 really structural? They just barely squeaked out a lower low. Given how big these moves are, scratching out another $0.05 doesn't hardly qualify as a lower low. I would really call that a failure if I was the guy selling $4.40 and was trying to make money pushing the market to lower lows. So maybe the sellers at $4.40 should not be shown to be structural sellers on the chart above? The following pictures continues to emphasize my lack of confidence on what market structure really is. Again, what's a good, clean, consistent definition of a structural buyer. I assume they are only confirmed when they take out a previously confirmed structural seller in the context below so there are not structural buyers that we for sure know about yet? 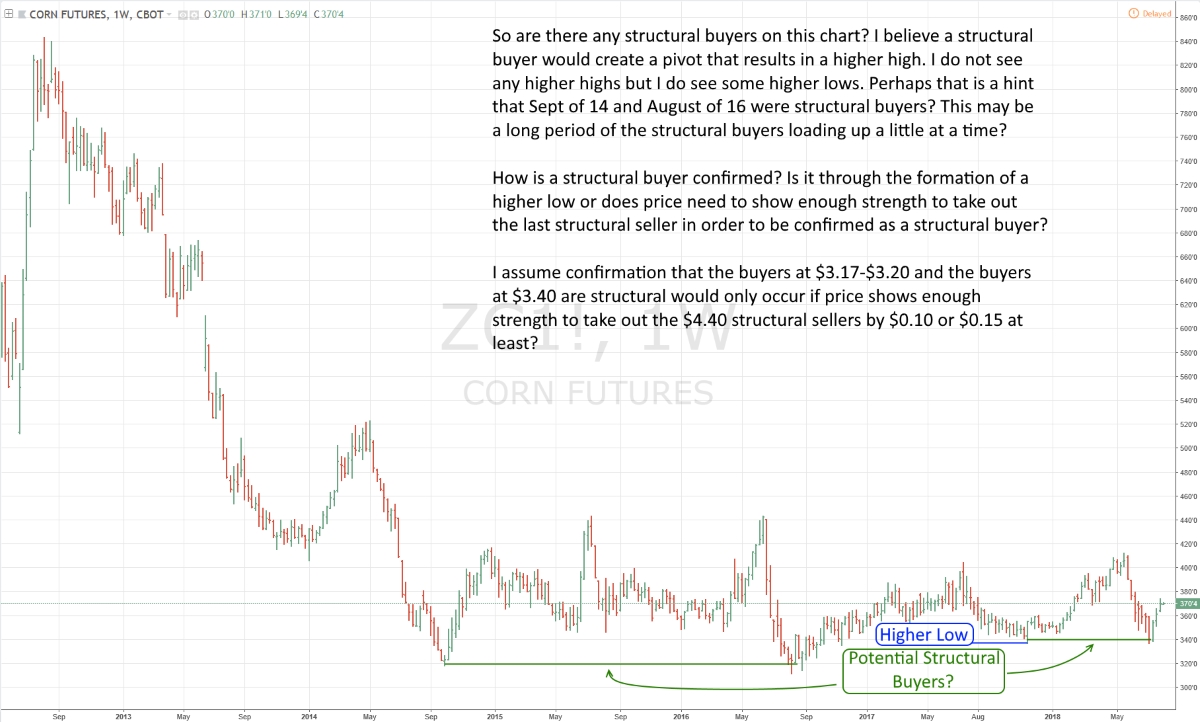
So this is really looking at the big picture. I suppose one could zoom out a bit more and observe the price runup as well but this is a pretty long term view we're looking at here. My take for whatever it's worth is that from a structural standpoint the sellers have been failing to make new lows in the corn market since about July of 2015. When a lower high was struck in July or so of 2015, the job of those sellers was to make a lower low and they failed to make significant progress. They failed again in August of 2016 after they held when buyers attempted to make a higher high. In late 2017 and early 2018 sellers failed to even match the previous low which I believe means buyers succeeded in creating a higher low. So just from a flat out structural standpoint, I'm getting to the point where I'm feeling like we have a bullish case to be made. Maybe not short term but the sellers at $4.40 have failed to create lower lows repeatedly. They are failed sellers and are destined to get taken out. I wouldn't go so far to say that we won't make a lower low. I just think it's likely that $4.40 gets taken out before $3.17 gets taken out. Is there anyone who enjoys structural analysis that is willing to tear that apart and tell me what I'm doing wrong and what I'm flat out failing to do? Thanks. |  Back to the basics: Market Structure

