| yup that's the chart.. Johnson said that when the AMO was negative.. it was mostly good for us.
![Map of drought frequencies in the USA.](https://wwwpaztcn.wr.usgs.gov/rsch_highlight/images/200404/drought_freq.jpg)
When the AMO is negative.. it's generally wet..
![Time series of the PDO and AMO.](https://wwwpaztcn.wr.usgs.gov/rsch_highlight/images/200404/time_series.jpg)
It flipped positive in about.. Well it depends upon how you smooth it.. and your source..
![Observed AMO index, defined as detrended 10-year low-pass filtered annual mean area-averaged SST anomalies over the North Atlantic basin <b></b>(0N-65N, 80W-0E<b></b>), using HadISST dataset <b></b>(Rayner et al. 2003<b></b>) for the period 1870-2015.](https://climatedataguide.ucar.edu/sites/default/files/styles/node_lightbox_display/public/key_figures/climate_data_set/AMOindex-Zhang.png?itok=1Kdwhlgn)
( https://climatedataguide.ucar.edu/climate-data/atlantic-multi-decadal-oscillation-amo )
Seems about 2,000.. So that puts us on the right side of the graphic above..
The PDO flipped.. in 2014.. 2015 ish..
![](http://research.jisao.washington.edu/pdo/pdo_tsplot_jan2017.png)
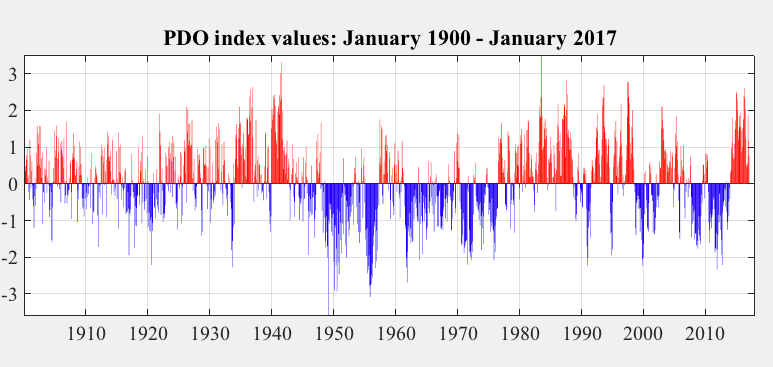
( http://research.jisao.washington.edu/pdo/ )
hmmm... fwiw. |