
In a van, down by the river. | I put together these charts for my own use as I try to put current land values into a long-term perspective. I fit into the camp of someone still younger than I am old, own no farmland, but would like to own some before I am too old to farm it, but don't want to jump in too soon because I can't afford to take more than one first shot... My biggest fear is jumping in too soon and impairing my balance sheet, as well as impairing my better half's appetite for land, if I'm wrong and prices ease much further. The first chart shows land values according to the NASS survey of Iowa land values going back to 1910. The chart looks like Al Gore's "hockey stick" global warming graph - it seems land values will go to the moon.
However, if you take the logarithmic transform of the land prices (second chart), and then squint a little bit, most of the land price appreciation of the past century fits a straight line of 4.8% compound annual growth. "Log" charts are useful because it allows you to view data in terms of percentage change. When viewed in these terms the current peak in land prices looks very similar to the peak of 1981. Indeed, if you make a plot of the difference between the surveyed land price and the 4.8% compound growth line (third chart), the current and 1981 peaks seem very similar. If you take the % annual value change data from the years just after 1981, then apply those values to 2016 and beyond, it makes kind of a neat "forecast" (red line).
While I suppose there are a million reasons why this forecast is probably wrong, it doesn't seem like it should be any more wrong than other W.A.G.'s. Based on these charts, if land prices fall at a pace similar to the 1981 peak, but much less drastically than the 1920 peak, surveyed Iowa land values should bottom in about four more years. That would be "mean reversion" at it's finest. Alternatively, if land prices will simply "adjust" by staying constant, it will take about 15 years for land values to intersect the long-term trend of 4.8% growth.
Does this type of analysis even seem reasonable? Why 4.8%? If we are to have deflation as some fear, why not an even lower CAGR? OK, that's all I've got, so now it would be great to get some feedback...
 (Land Price Chart.jpg) (Land Price Chart.jpg)
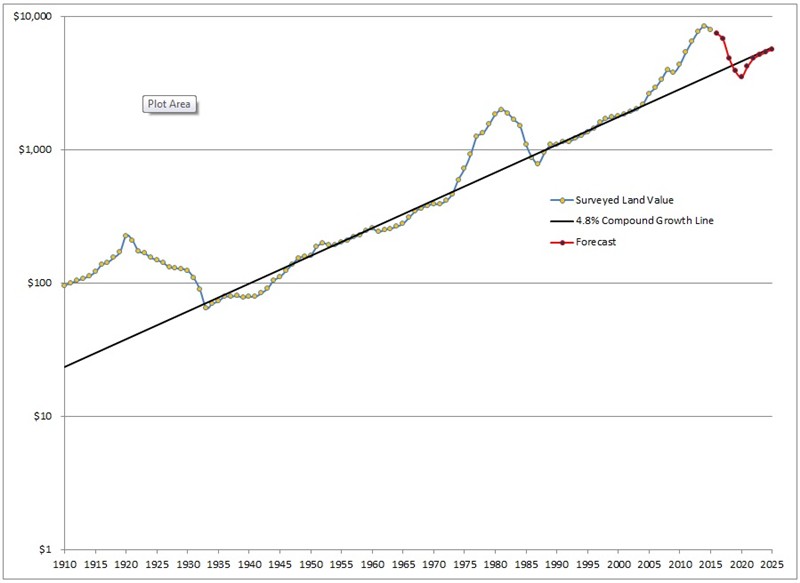 (Log Land Price Chart.jpg) (Log Land Price Chart.jpg)
 (PctDev Chart.jpg) (PctDev Chart.jpg)
Attachments
----------------
 Land Price Chart.jpg (56KB - 136 downloads) Land Price Chart.jpg (56KB - 136 downloads)
Log Land Price Chart.jpg (45KB - 146 downloads)
PctDev Chart.jpg (40KB - 151 downloads)
|
 Land Prices and Mean Reversion

