Centre county Pennsylvania, USA | Here is the meat from Schlenker's paper:
" We find that yields increase with temperature up to 29° C for corn, 30° C for soybeans, and 32° C for cotton but that temperatures above these thresholds are very harmful. The slope of the decline above the optimum is significantly steeper than the incline below it. The same nonlinear and asymmetric relationship is found when we isolate either time-series or cross-sectional variations in temperatures and yields. "
USDA scientists Westcott and Jewison use similar findings in their " weather Effects on Expected Corn and Soybean Yields model" paper.
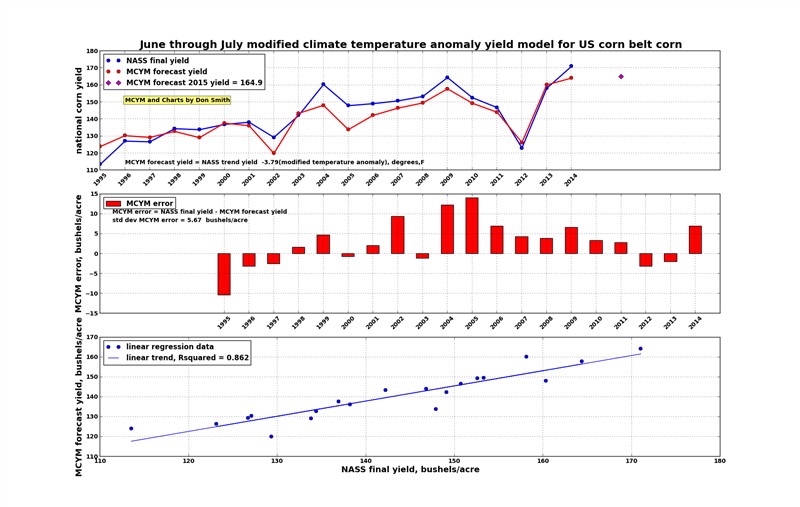
Taking a que from those findings, I have modified my Climate Yield Model by non-linear weighting June through July temperature anomoly and named it " Modified Climate Yield Model" (MCYM). As shown in the attached chart, that modification produced an Rsquared value of 0.862 for back-test of the most recent 20 years of USDA and NOAA data (86.2 percent of national corn yield is explained by the modified climate yield model. Standard deviation of error for that 20 year time series is 5.67 bushels/acre.
The non linear weighting of climate temperature anomaly is relatively simple. Replace all temperature anomalies > 1.5 degree F by temperature anomaly^1.8 power. (temperature anomaly rised to the 1.8 power). I tried different weighting powers, and different onset of weighting, but found those are the weightings and onset of weighting that produced greatest Rsquared and lowest error standard deviation.
I'm almost certain that MCYM gives good performance for national corn yield because national corn yield temperature anomaly and precipitation anomaly are correlated in the corn belt. It's performance over smaller geographical areas (state or local) is less than steller, probably because climate temperature anomaly and climate precipitation anomaly are not correlated in those smaller geographical areas.
 (MCYM_cornbelt_back-test performance.png) (MCYM_cornbelt_back-test performance.png)
Attachments
----------------
 MCYM_cornbelt_back-test performance.png (88KB - 43 downloads) MCYM_cornbelt_back-test performance.png (88KB - 43 downloads)
|


 JonSCKs, El Nino