| Okay.. First off BE CAREFUL.. this is a TOTAL WAG.. but I took this info.. 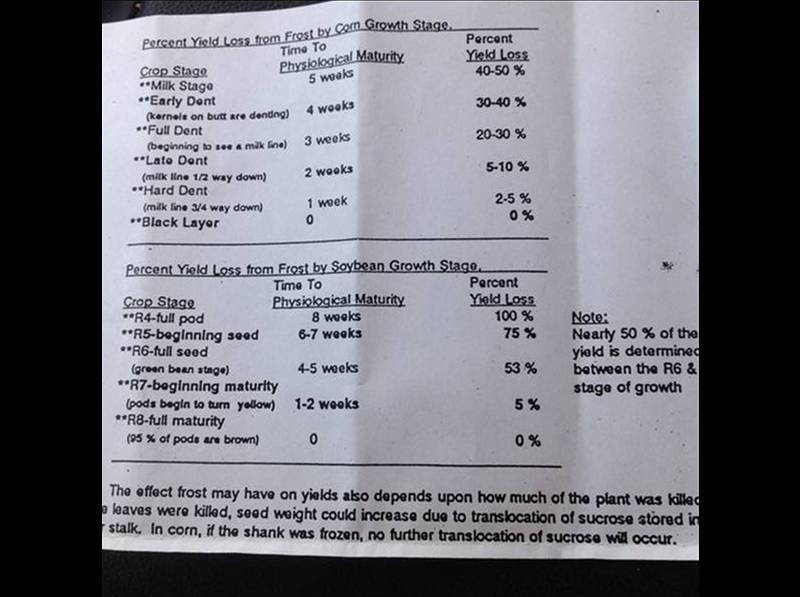
and looked back 3 weeks to find the % R4 Full pod.. Soybeans Setting Pods – Selected States [These 18 States planted 95% of the 2013 soybean acreage] | State | Week ending | 2009-2013 Average | August 24, 2013 | August 17, 2014 | August 24, 2014 | (percent) | (percent) | (percent) | (percent) | Arkansas ................................... Illinois ........................................ Indiana ...................................... Iowa .......................................... Kansas ...................................... Kentucky ................................... Louisiana .................................. Michigan ................................... Minnesota ................................. Mississippi ................................ Missouri .................................... Nebraska .................................. North Carolina ........................... North Dakota ............................. Ohio .......................................... South Dakota ............................ Tennessee ................................ Wisconsin ................................. 18 States .................................. | 88 82 87 81 70 64 97 91 83 94 63 93 52 91 91 89 75 73 82 | 87 89 90 88 63 63 94 87 85 85 70 89 54 88 80 81 75 79 83 | 94 94 94 94 78 72 97 92 92 91 82 95 69 94 91 93 84 88 90 | 91 88 87 93 75 79 98 92 92 98 73 94 67 96 92 93 87 87 89 |
and subbed that into my August Soybean Acreage data.. I don't have last week's update so this will have to be "good enough." and found this.. | | ------------------------------------------------------------------------------------------- | | | | | | : Area harvested : Yield / acre : Production | | | | | | | | State % setting pods | 3 weeks before event | | | | August 24th | | | | | | | ------------------------------------------------------------------------------------------- | | State bu | | | | : 1,000 acres : --bushels-- : -- 1,000 bu -- | % affected | | Hit | | | | | | | | | | | | | | | | WAG | 53% | percent yield hit | | | | Alabama | | 500 | | | | 41.0 | | | 20,500 | | | | | | | | | | Arkansas | | 3,350 | | | | 46.0 | | | 154,100 | | | | | | | | | | Delaware | | 183 | | | | 42.0 | | | 7,686 | | | | | | | | | | Georgia | | 270 | | | | 37.0 | | | 9,990 | | | | | | | | | | Illinois | | 10,050 | | | | 54.0 | | | 542,700 | | 82% | 10% | 1.80% | 5,177 | 0.5 | | | | Indiana | | 5,490 | | | | 51.0 | | | 279,990 | | 87% | | | | | | | | Iowa | | 10,040 | | | | 50.0 | | | 502,000 | | 81% | 40% | 7.60% | 20,221 | 2.0 | | | | Kansas | | 4,190 | | | | 36.0 | | | 150,840 | | 70% | 20% | 6.00% | 4,797 | 1.1 | | | | Kentucky | | 1,690 | | | | 40.0 | | | 67,600 | | | | | | | | | | Louisiana | | 1,440 | | | | 50.0 | | | 72,000 | | | | | | | | | | : | | | | | | | | | | Maryland | | 495 | | | | 44.0 | | | 21,780 | | | | | | | | | | Michigan | | 2,290 | | | | 44.0 | | | 100,760 | | 91% | 67% | 6.03% | 3,220 | 1.4 | | | | Minnesota | | 7,420 | | | | 42.0 | | | 311,640 | | 83% | 85% | 14.45% | 23,867 | 3.2 | | | | Mississippi | | 2,220 | | | | 48.0 | | | 106,560 | | | | | | | | | | Missouri | | 5,650 | | | | 44.0 | | | 248,600 | | | | | | | | | | Nebraska | | 5,350 | | | | 52.0 | | | 278,200 | | 93% | 67% | 4.69% | 6,915 | 1.3 | | | | New Jersey | | 93 | | | | 40.0 | | | 3,720 | | | | | | | | | | New York | | 397 | | | | 49.0 | | | 19,453 | | | | | | | | | | North Carolina | | 1,670 | | | | 37.0 | | | 61,790 | | | | | | | | | | North Dakota | | 5,950 | | | | 32.0 | | | 190,400 | | 91% | 75% | 6.75% | 6,812 | 1.1 | | | | : | | | | | | | | | | Ohio | | 4,940 | | | | 49.0 | | | 242,060 | | | | | | | | | | Oklahoma | | 295 | | | | 31.0 | | | 9,145 | | | | | | | | | | Pennsylvania | | 600 | | | | 49.0 | | | 29,400 | | | | | | | | | | South Carolina | 440 | | | | 29.0 | | | 12,760 | | | | | | | | | | South Dakota | | 4,910 | | | | 40.0 | | | 196,400 | | 89% | 75% | 8.25% | 8,588 | 1.7 | | | | Tennessee | | 1,580 | | | | 44.0 | | | 69,520 | | | | | | | | | | Texas | | 125 | | | | 27.0 | | | 3,375 | | | | | | | | | | Virginia | | 590 | | | | 40.0 | | | 23,600 | | | | | | | | | | Wisconsin | | 1,780 | | | | 43.0 | | | 76,540 | | 73% | 75% | 20.25% | 8,215 | 4.6 | | | | : | | | | | | | | | | Other States 1/ | 60 | | | | 42.8 | | | 2,568 | | | | | | | | | | : | | | | | | | | | | United States ......: 75,869 84,058 43.3 45.4 3,288,833 3,815,679 | 84,058 | | | | 45.4 | | | 3,815,677 | | 82% | | | 87,811 | 1.04 | bu Nationally | So.. Kansas had 70% setting pods.. or 30% NOT there yet.. I ASSUME that 20% of THAT was impacted by this weekend.. thus 6% total might see a 53% reduction in production or 4.797 myn bushels total out of a 150.84 myn bushel crop. Now remember that there will be more damage in production that is further along.. but I assume that is somewhat offset by not everything is going to see a 53% hit.. This puts Minnesota at 23.8 myn bushels lost and Iowa at 20.2.. Bears may argue that is from some higher yield than what USDA has recognized thus far.. but..??? I would GUESS it is SOMEWHERE around 100 myn bushels overall or about 1.04 bushels nationally... could be more.. could be less.. Fire away.. |
 Frosted Bean Numbers

