| So we're basically wrapping up 2019/20 with the ethanol grind number down 10.3% vs the previous year.. "could be better.. could be worse." All in all probably not bad given Covid 19 et all. Gasoline demand is down 9.0% so we lost a little market share.. gained probably on hand sanitizer.. and exports were flat.. or thereabouts as my implied number was up 0.5%
Total ethanol demand was down 8.7%
The WASDE has a 7.2% increase for Corn used for ethanol built into next year's forecast.. about a 350 myn bu increase.. that's possible but unless we see things improve some more.. seems a little high.. given current trends. Although with pulling the sorghum out of the grind.. they may have some room to bump this year's numbers a bit.. give or take a little.
The Rally in Corn prices did back the ethanol grind off.. but most plants are probably doing maintenance to get ready for this fall/winter...so it's too soon for me to speculate more than I already have..
The Stock market has been on a tear.. employment numbers are improving but still a big hole from the Shut downs.. so until the economy fully recovers.. and no more shut downs on the horizon.. still a murky future.
One Caveat Crude oil production dipped to 9.7 myn bbls per day.. on the shut ins in the gulf from the hurricanes. the week before was 10.8.. both down substantially from 13.1 myn bbls per day before the shutdowns.
https://www.eia.gov/dnav/pet/hist/LeafHandler.ashx?n=PET&s=WCRFPUS2&f=W
It's been a rough go in the oil patch also. with drilling rigs down 650 from a year ago... Ouch! At some point that will leave a mark on production.. but.. not enough to matter for now..??
| Area | Last Count | Count | Change from Prior Count | Date of Prior Count | Change from Last Year | Date of Last Year's Count |
|---|
| U.S. | 28 Aug
2020 | 254 | 0 | 21 Aug
2020 | -650 | 30 Aug
2019 | | Canada | 28 Aug
2020 | 54 | -2 | 21 Aug
2020 | -96 | 30 Aug
2019 | | International | July
2020 | 743 | -38 | June
2020 | -419 | July
2019 |
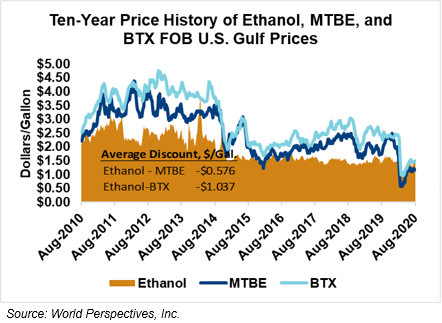
Ethanol is slugging it out with now Cheaper Toxic Octane alternatives..
https://grains.org/ethanol_report/ethanol-market-and-pricing-data-september-2-2020/
| | | | | | | | | | | | | Computed | | | | | | | | | | | | | Weekly Production | | | | | | | | | number to balance | Computed | Actual | Total | Weekly bu | | Weekly US | | | Week | | Blenders Input | | Imports | Stocks | Capacity | Residual and exports | Exports | Exports | Ethanol | Grind | Vs Last year | Change | Supplied Finished | | | | Ethanol k bbls/day | | k bbls /day | k bbls /day | k bbls | k bbls | | k bbls /day | k bbls | Monthly | EIA | demand | | | | Motor Gasoline | | | | | | | | | | | | | 37,936 | | | | | | | | 2.85 | conversion | | | Ethanol as % of | | | | | | | | | | | | | | | | | | | | | | | | | | | 7/3/2020 | 914 | | 79.4% | | 850 | | 36 | | 20,620 | 54% | | 34.9 | | 244 | | | 884.9 | 94,286 | 108,006 | -13,720 | 8766 | 9.70% | | | 7/10/2020 | 931 | | 80.9% | | 819 | | 0 | | 20,608 | 54% | | 113.7 | | 796 | | | 932.7 | 96,040 | 109,966 | -13,926 | 8648 | 9.47% | | | 7/17/2020 | 908 | | 78.9% | | 839 | | 0 | | 19,801 | 52% | | 184.3 | | 1290 | | | 1023.3 | 93,667 | 107,181 | -13,514 | 8550 | 9.81% | | | 7/24/2020 | 958 | | 83.2% | | 853 | | 27 | | 20,272 | 53% | | 64.7 | | 453 | | | 917.7 | 98,825 | 106,356 | -7,531 | 8809 | 9.68% | | | 7/31/2020 | 931 | | 80.9% | | 844 | | 11 | | 20,346 | 54% | | 87.4 | | 612 | 3395 | | 931.4 | 96,040 | 107,284 | -11,244 | 8617 | 9.79% | | | 8/7/2020 | 918 | | 79.8% | | 861 | | 24 | | 19,750 | 52% | | 166.1 | | 1163 | | | 1027.1 | 94,699 | 107,800 | -13,101 | 8883 | 9.69% | | | 8/14/2020 | 926 | | 80.5% | | 860 | | 0 | | 20,270 | 53% | | -8.3 | | -58 | | | 851.7 | 95,524 | 105,531 | -10,006 | 8630 | 9.97% | | | 8/21/2020 | 931 | | 80.9% | | 854 | | 12 | | 20,409 | 54% | | 69.1 | | 484 | | | 923.1 | 96,040 | 107,078 | -11,038 | 9161 | 9.32% | | | 8/28/2020 | 922 | | 80.1% | | 861 | | 36 | | 20,882 | 55% | | 29.4 | | 206 | | | 890.4 | 95,112 | 104,499 | -9,387 | 8786 | 9.80% | | | | | | | | | | | | | | | | | | | | | | | | | | | | | | | capacity | | | | | | | | | | | | | | | | | | | | | 19/20 MY 52 wks | 929.0 | | 1151 | | 829.3 | | 10.3 | | 22642.4 | 59.7% | | 118.0 | | 826.0 | 3741.5 | 2880.2 | 947.3 | 95,832 | 105,404 | -570,773 | 8465.6 | 9.79% | | | 18/19 MY 52 wks | 1035.3 | | | | 920.3 | | 5.3 | | 23251.2 | 61.3% | | 117.4 | | 821.6 | 3560.2 | 3096.9 | 1037.7 | 106,802 | 109,030 | | 9301.9 | 9.90% | | | 15 byn target: | | | | 978.0 | | | | | | | | | | | | | -10,970.4 | -3,626 | | | | | | 19/20 vs 18/19 | -10.3% | | | | -9.9% | | 1 | | -2.6% | | | 0.5% | | 0.5% | 5.1% | -7.0% | -8.7% | -10.3% | -47,143 | bu lower | -9.0% | -1.1% | | | | | | | | -15.2% | | | | | | | | | estimated | Reported | | | | | | | | | 1013 | | | | 952 | | Last year | 23801.0 | yr ago | | -30 | | -210 | | | 922 | | | | 9471 | 10.05% | | Cheers. Weekly production number http://www.eia.gov/dnav/pet/hist/LeafHandler.ashx?n=pet&s=w_epooxe_yop_nus_mbbld&f=w Weekly Blenders Input.. http://www.eia.gov/dnav/pet/hist/LeafHandler.ashx?n=pet&s=w_epooxe_yir_nus_mbbld&f=w Weekly Imports of Ethanol http://www.eia.gov/dnav/pet/hist/LeafHandler.ashx?n=PET&s=W_EPOOXE_IM0_NUS-Z00_MBBLD&f=W Weekly Stocks number http://www.eia.gov/dnav/pet/hist/LeafHandler.ashx?n=PET&s=W_EPOOXE_SAE_NUS_MBBL&f=W Weekly US Product Supplied of Finished Motor Gasoline http://www.eia.gov/dnav/pet/hist/LeafHandler.ashx?n=PET&s=WGFUPUS2&f=W Monthly US Exports of Ethanol http://www.eia.gov/dnav/pet/hist/LeafHandler.ashx?n=PET&s=M_EPOOXE_EEX_NUS-Z00_MBBL&f=M Ethanol Supply and Disposition https://www.eia.gov/dnav/pet/PET_SUM_SND_A_EPOOXE_MBBL_M_CUR.htm US Grains Council update https://grains.org/ethanol_report/ethanol-market-and-pricing-data-september-2-2020/ |
 Ethanol update. Year on Year Grind down 10.3%

