This data is from a field where corn was planted into corn stubble. This is irrigated planted at 32000 population.
The first chart shows the maximum temperatures on a daily basis.
The next two charts shows temperatures on a hourly basis on specific days.
 (ant sw nbc 8 6 2011.jpg) (ant sw nbc 8 6 2011.jpg)
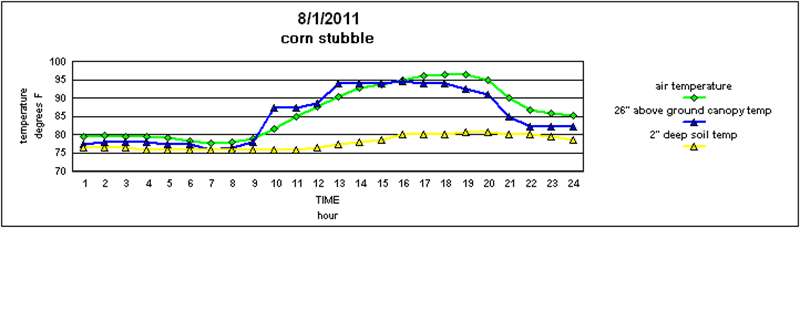 (canopy temps chart 8 1 2011.jpg) (canopy temps chart 8 1 2011.jpg)
 (canopy temps chart 8 4 2011.jpg) (canopy temps chart 8 4 2011.jpg)
Attachments
----------------
 ant sw nbc 8 6 2011.jpg (25KB - 34 downloads) ant sw nbc 8 6 2011.jpg (25KB - 34 downloads)
canopy temps chart 8 1 2011.jpg (26KB - 37 downloads)
canopy temps chart 8 4 2011.jpg (28KB - 33 downloads)
|  yet again corn canopy charts

