|

South Central Iowa | Crude Oil gave a negative feel across the entire commodity sector last week. I thought I would throw up some charts and see what my technical analysis could make of the situation. I am not in crude oil currently. May enter if it plays out well. Using it as a guinea pig for my new-to-me system PnF and because it does have an impact on our markets as well.
The first chart is my bar chart analysis. This is a possible scenario I could see playing out. We broke off support of the ascending 2/3 speed line and broke the lower MLH of an ascending fork that is not included on the chart. We then zoomed through the descending fork in red. The downside target for me is now at the 1/2 speed line around $44.40. This would be a further bleeding of $4.00 in the first 3 days of this week and then on Wednesday, an EIA report is out. I could see a technical rally off support from the 1/2 speed, regardless of what EIA says. This would allow for the fulfillment of a retouch of the upper MLH of the descending fork. As we approach the retouch, heavy selling pressure would ensue and force the greater downward move. From $49-$50 we would fall down to approximately $40 for a confirmation of the median line by mid-late April. This is an area I would look for a low in and a point at which the market can begin to rebuild and attempt a new move higher.
The second chart is my Point and Figure analysis. The moving averages that I have read are good to accompany PnF actually gave a momentum change indication last Tuesday when we were still trading $53+..... So that's something to watch in the future.... With the momentum change to the downside, PnF gave a sell signal at $49 on Thursday by breaking the double bottom's (note that double bottom is a little different in PnF, it is when you strike any prior point) at $50 and $49 and more importantly, the bullish support line at $50. This column of O's is not complete, so there is no vertical count target for the downside yet, but the horizontal count is available and it targets $44, which is also the next location of support so there is agreement in PnF on that area.
Both systems have us turned down for a negative move and there is good agreement on price and support. If the bar chart scenario plays out and a small reversal occurs between $46.40 and $50, a vertical count would become available and it would target $40, which would correspond with the bar chart's median line confirmation, I like that! Of course that greater down move would fulfill the horizontal target of $44. The bar chart's target of $39.50-$40.50 would also allow PnF to hold support at $39 and keep intact the possibility of its targets that are mentioned in the PnF chart of $67 and $79. I will mention that PnF has no time scale, the x-axis is measured in columns, so as long as the uptrend holds, those targets are alive. Break $39 and the $79 target will be invalidated, break $26 and the $67 is invalidated. But as long as it holds those numbers, those upper targets are valid even if they are not fulfilled until 2025 or whenever. But with the fulfillment of the median line touch and a holding of $39, that is a good area to look at as a bottom for the downswing.
Edit: I forgot to add a couple things I did not include in the PnF chart for clutter reasons. There are two failed formations. One is the Bullish Catapult formation which failed to propel far higher on the second demand (X's) column from the right. The second is by breaking the bullish support line, this is not what is referred to as a "bullish shakedown" manuever. These failures are not good signs for the demand (buy) side.
Edited by Conan the Farmer 3/12/2017 17:42
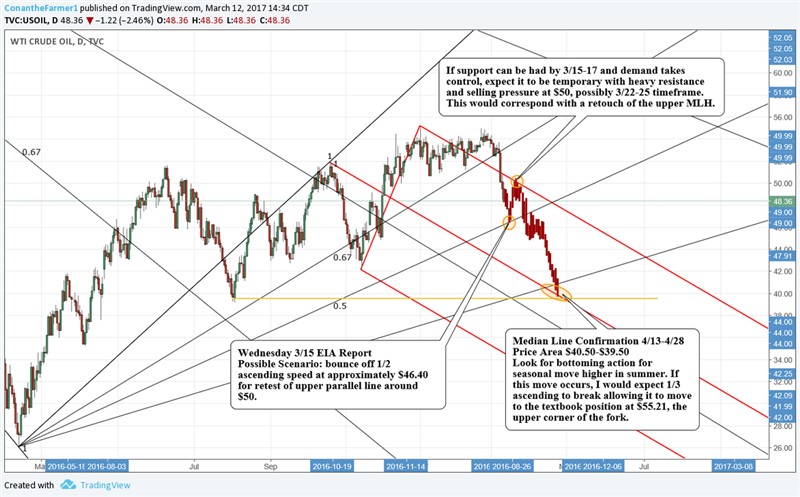 (USOILMarch12Bar.png) (USOILMarch12Bar.png)
 (USOILMarch12PnF.png) (USOILMarch12PnF.png)
 (CRUDEOIL Seasonal.gif) (CRUDEOIL Seasonal.gif)
 (NakedOilChart.png) (NakedOilChart.png)
Attachments
----------------
 USOILMarch12Bar.png (113KB - 136 downloads) USOILMarch12Bar.png (113KB - 136 downloads)
USOILMarch12PnF.png (110KB - 134 downloads)
CRUDEOIL Seasonal.gif (98KB - 138 downloads)
NakedOilChart.png (66KB - 121 downloads)
| |
|
 Crude Oil Charts

