Middle Tennessee | I do my best to keep informed on the markets, this site and some of you guys have been a big help there. Now, the CME also distributes information, but it seems whenever I look at it carefully, it doesn't check out.
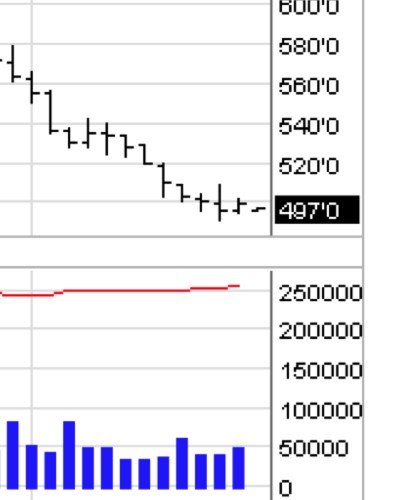
Below is a daily chart for Chicago wheat. I try to follow the volume bars and price, probably to finer detail than is necessary or fruitful. Nonetheless, I expect the information to be correct. Note on the chart, there are 12 price bars subsequent to the vertical line indicating the beginning of September. Note there are 11 volume bars. That makes sense, because the 12th volume bar indicates tonight's terrible trade, and there's no volume finalized for Thursday trade. But look more carefully. Wednesday was Hedge Fund Short Cover Wednesday, sort of like Taco Tuesday, or Two 'Fer Thursday. The volume was anemic, under 35k for the Z contract (predictably the Bulletin shows interest down 1k, if that report can be trusted). The volume bar shows a much larger volume. Glancing at the Settlements record, it looks like what the CME is doing is superposing prior-day volume with subsequent-day price. I hope I'm not in error here, I triple checked. Why do they screw stuff like this up? Because they're stupid? Because they don't care? Or to make things as tough as possible for people like me?
 (Daily.png) (Daily.png)
Attachments
----------------
 Daily.png (33KB - 695 downloads) Daily.png (33KB - 695 downloads)
|
 Things that make my paranoid, undiagnosed Asberger's self nuts

