
Centre county Pennsylvania, USA | Monthly sales of most Ag commodities, as percent of market year, are available from the NASS Quickstats 2 server. Attached zipped spreadsheet has those numbers for corn,soybeans and wheat for US and US states in all months of 12 recent years. A graphical form of that data for US geographical area is shown in the attached charts. The 12 year average sales within the US geographical area for each month is shown as a dashed black line in each chart.
This NASS data appears to show that largest sales volume, as percent of market year, occurs in the months that have historically lowest prices (seasonals).
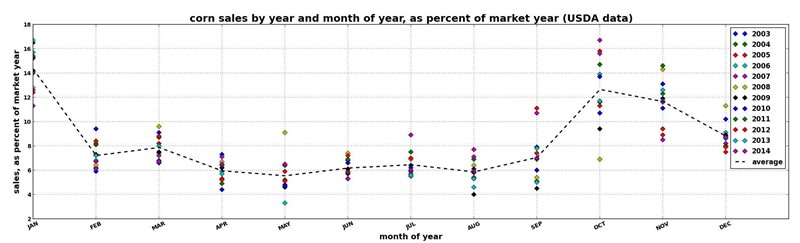 (corn_sales_as_percent_of_market_year.jpg) (corn_sales_as_percent_of_market_year.jpg)
 (soybean_sales_as_percent_of_market_year.jpg) (soybean_sales_as_percent_of_market_year.jpg)
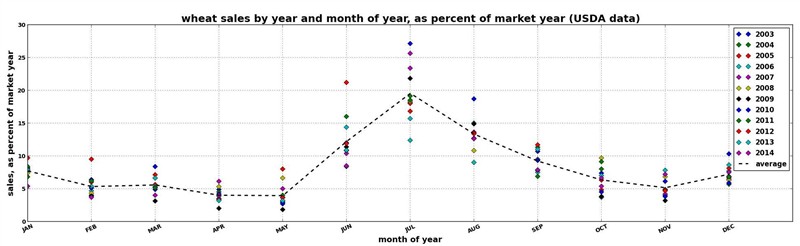 (wheat_sales_as_percent_of_market_year.jpg) (wheat_sales_as_percent_of_market_year.jpg)
Attachments
----------------
 sales_as_percent_of_market_year.zip (44KB - 76 downloads) sales_as_percent_of_market_year.zip (44KB - 76 downloads)
corn_sales_as_percent_of_market_year.jpg (43KB - 60 downloads)
soybean_sales_as_percent_of_market_year.jpg (41KB - 61 downloads)
wheat_sales_as_percent_of_market_year.jpg (38KB - 65 downloads)
|
 Monthly sales of Ag commodities in the US

