|
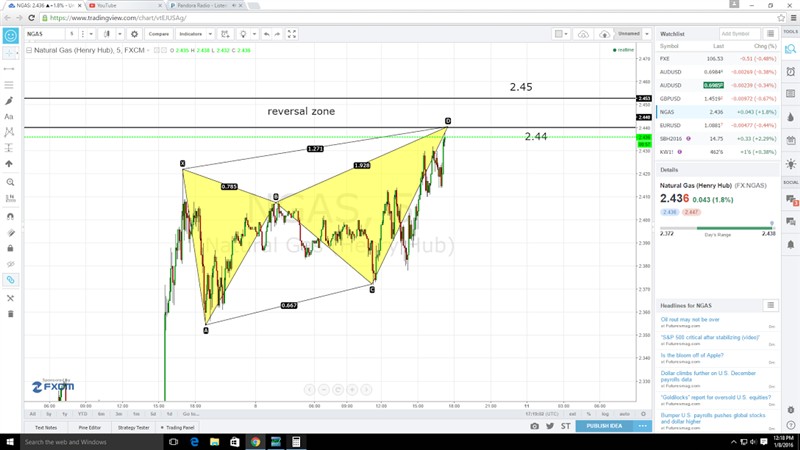
| natural gas has built in a pattern on the 5 min chart that usually appears in w4 's and has met all the qualifications down to the tick so i will be watching for some sort of reversal around the 244-45 area which as of this writing 244 has touched.
I will be putting in a small position short here looking for at least a 10-20 cent correction.
-This is also resistance of the prior 4th wave ...... lets see if we reverse here
[email protected]
Edited by Mr Enigma 1/8/2016 11:30
 (nat gas 5 min chart.png) (nat gas 5 min chart.png)
Attachments
----------------
 nat gas 5 min chart.png (74KB - 85 downloads) nat gas 5 min chart.png (74KB - 85 downloads)
| |
|
 natural gas ... rdy to correct

