
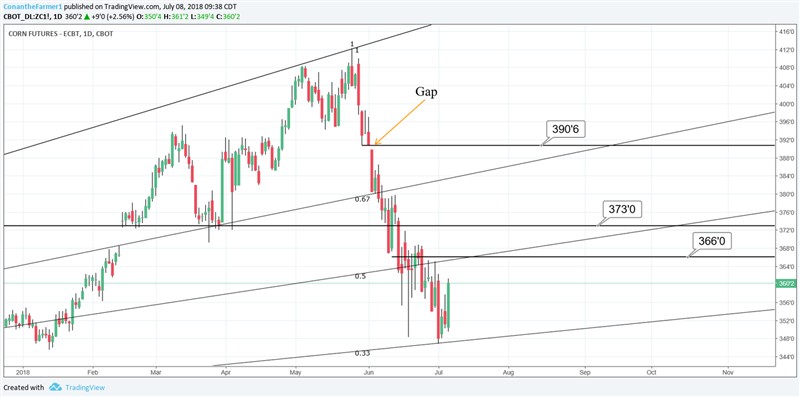
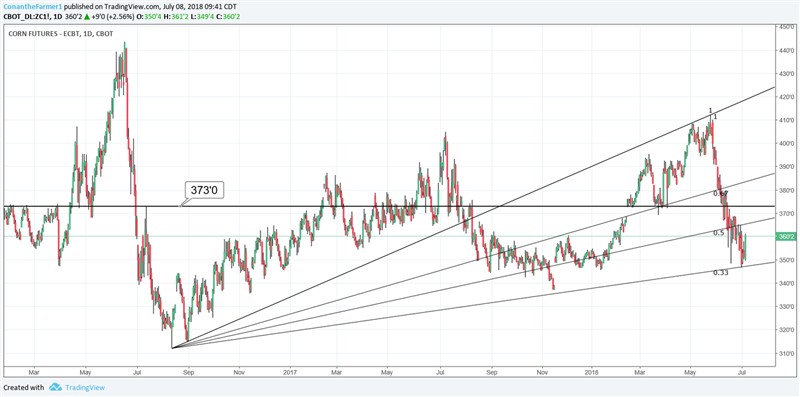
South Central Iowa | Continuous basis September, I am looking at $3.66 as our first overhead resistance. That represents an accumulation zone and topside of a 1/2 SRL basis our 2016 low and 2018 high, our lowest in over a decade and it's highest high since. The 1/3 did contain our bottom side from the drop and played very nicely. I like $3.73 from a long ways back, it is important in corn. Of course we have a true blue gap, small as it is, sitting from $3.89'6-$3.90'6. Clear the most major resistance at $3.66-$3.73 and I think we have that additional 18c run in us.
Yeah, we filled that roll gap... (See here) …. That was a fail... Yuck.
 (July 8 Corn I (full).png) (July 8 Corn I (full).png)
 (July 8 Corn II (full).png) (July 8 Corn II (full).png)
Attachments
----------------
 July 8 Corn I (full).png (61KB - 56 downloads) July 8 Corn I (full).png (61KB - 56 downloads)
July 8 Corn II (full).png (64KB - 73 downloads)
|
 Corn charts

