|

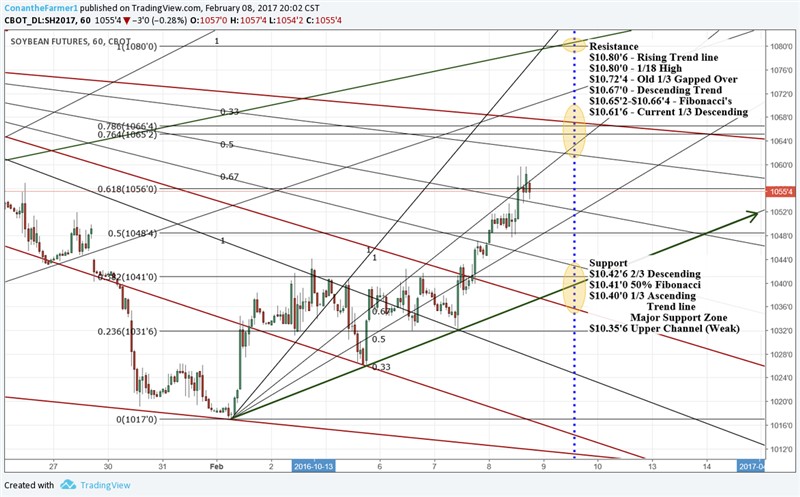
South Central Iowa | I will throw this chart out for anyone interested. The blue line shows 11:00 tomorrow, Wasde release time. The major resistance above is $10.65-67 and $10.80-81. The first numbers are Fibonacci's and an untested trend line from the summer high to our post harvest high so far. $10.80 is the January 18 high and $10.80'6 is a rising trend line that has caused reactions numerous times in our post-harvest rally.
The major support is at $10.40-41. That is the 38% Fibonacci at $10.41 and a confirmed trend line and the current 1/3 ascending speed line. The low $10.40's is also just a zone that the market has shown an attraction for as we have seen the past few days and at prior times. Below that is the old hourly upper channel line at $10.35'6. That line never was confirmed and broke like glass, so I really wouldn't expect much of a fight out of it. On below is major support in the $10.10's, but hopefully we don't need that, haha!
It is suppose to be a nothing report and hopefully it is and we can just continue our little uptrend for now. The primary boundaries of trade (THE THUNDERDOME!) will be from $10.40-$10.67 and we sit at $10.55 currently. I will add that we have seen a willingness for funds to want to buy out of these reports of late and even do it in spite of poor or neutral news. This was very obvious in the August and September Wasde's and I believe it the case in the January Production report as well. They pretty much seemed bent on buying straight out of the gate and regardless of what the report even says. This doesn't mean anything per se, just an observation I have made and one that sticks in my gut because I have been short going into most of those reports. I'm long currently, so you know what that means...... haha!
EDIT: SIMPLE NUMBERS Resistance $10.67 and $10.80; Support $10.40. The $10.40 area is the strongest spot on that chart currently.
DOUBLE EDIT: I wrote 50% Fib on the support and that is incorrect, it is 38%.
Edited by Conan the Farmer 2/8/2017 20:41
 (FebWASDEtargets.png) (FebWASDEtargets.png)
 (FebWASDEspeedtrend.png) (FebWASDEspeedtrend.png)
 (Thunderdome.png) (Thunderdome.png)
Attachments
----------------
 FebWASDEtargets.png (114KB - 122 downloads) FebWASDEtargets.png (114KB - 122 downloads)
FebWASDEspeedtrend.png (101KB - 111 downloads)
Thunderdome.png (105KB - 102 downloads)
| |
|
 bean rally

