|

South Central Iowa | I was going to post this down below on my soybean chart thread for anyone who cared to look, but it is related to your point. I am not very surprised that we have a pullback. This is a consolidation phase for this minor move. Really, to me, it seems fairly strong. I thought we would do a 50% retracement, but not yet anyhow. $10.01'4 is the number to watch for me as a bottom for today, there is a trend line and the 38% retracement of yesterday's move at that point.
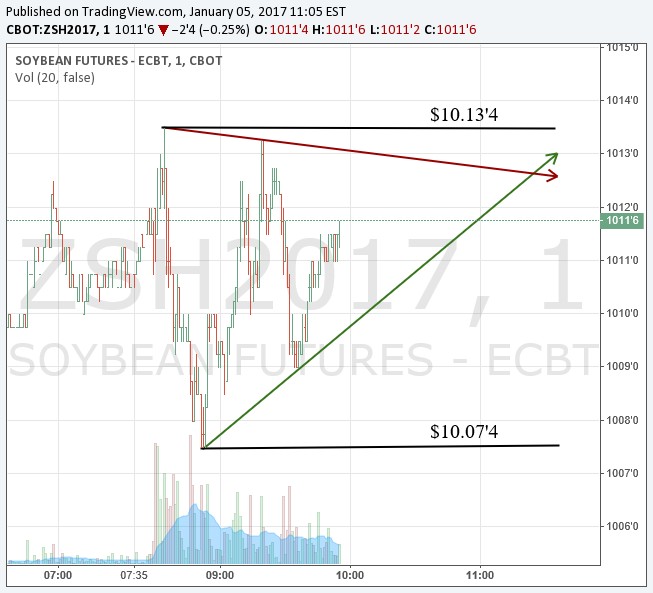
But what I was going to post is intraday minute chart. It is forming an ascending triangle which is a bullish consolidation move. The top red line is a trend line that is actually from our December high. That is fairly stiff resistance.
Reason I was going to post below was to show what I said I like to trade. To me, every market makes a high and a low, trades in between, forms a wedge, and then breaks the wedge to a new direction. This is just showing how it does it most every day. This particular wedge will be decided by 11:30, and I don't think there will be strength to a downside breakout.
Edited by Conan the Farmer 1/5/2017 10:11
 (CmfVOfFs.png) (CmfVOfFs.png)
Attachments
----------------
 CmfVOfFs.png (73KB - 50 downloads) CmfVOfFs.png (73KB - 50 downloads)
| |
|
 Todays action

