|
Buxton ND | Blast off YEP,,,,,,, here's the place to post that bull rockets ship picture. First 2 paragraphs is what I posted yesterday.
More important this morning is the US $$$ breaking above $98 after consolidating just under it for a week. Next is 100/100.50 IS MUST NOT BREAK AND CLOSE ABOVE THIS LEVEL. Check out the EDXZ chart, very interest and you will see some very rare stuff.
Curious ? What is it ?
I've been very quiet on this. IF the US $$$ started breaking of $100 IMO some off our front loaded export sales will be at risk.
This is little different this time around with our $$$ vs Brazilian REAL has been stronger since breaking out breaking higher of March 4th this was part of the reason for the #CCRally in beans.
EVERY moving average on every chart is moving higher with the only exception being the 200 day on a monthly.
Daily broke higher on 9-16
Weekly broke higher the first part on Oct with this breaking the monthly higher also.
I refuse to look for levels under 2.90 corn until forced to, so will do the same with levels over $100 in the US $$$
This whole big long term dollar move higher happened very, VERY, VERYYYY quietly on July 14th 2014
In my market history book July 14th 2014 is the most important day for American Agriculture of the 2010's
This is a big reason why I've been the donkey wipe bean bear. EDX vs 6L = US $$$ vs the Brazilian REAL is HUGE in beans.
The $$$ breaking got no attention in NAT, social media or farm market land til 2-3 month AFTER the fact.
Like Maize says "What everyone knows ain't worth knowing"
I will add "What everyone know has already been traded"
On the flip side of this look when crude oil broke lower its text book prefect chart PRICELESS move and it did on the very bull ISIS manure hitting the fan. Here's a long term US $$$ chart, the dark shaded part of price hits when the index was changed to the index we know today. If you compare farm gate prices when it in the 130-150 range in the 80's or the $110-120 range in the early 2001 is show you the real story
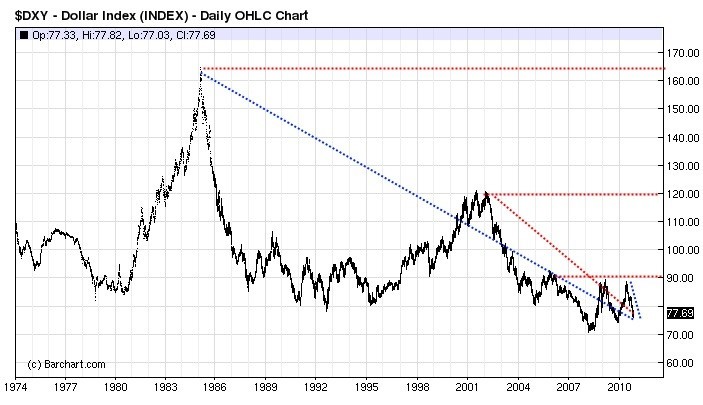 (LONG TERM DOLLAR image.jpg) (LONG TERM DOLLAR image.jpg)
Attachments
----------------
 LONG TERM DOLLAR image.jpg (73KB - 60 downloads) LONG TERM DOLLAR image.jpg (73KB - 60 downloads)
| |
|
 Dollar index

