Centre county Pennsylvania, USA | Thanks all, great comments.
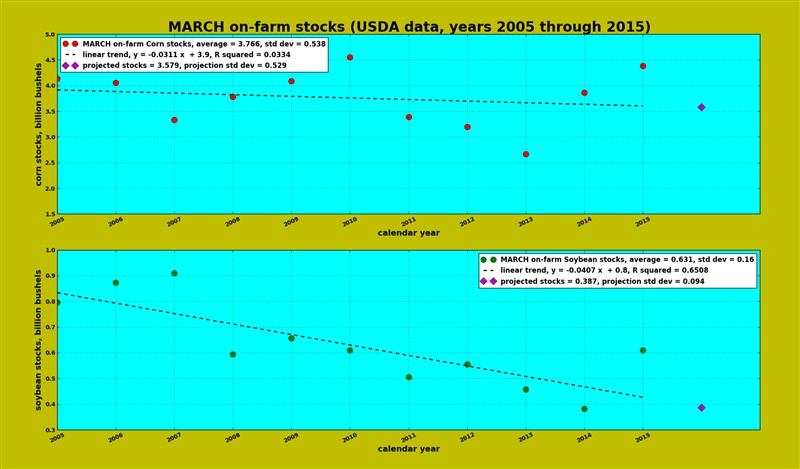
Probably some degree of truth in all, but unsure on how to verify most. Did verify comment by Richard (1234): "In fact your chart shows a very pronounced trend for lower on-farm bean stocks since 2007 in line with the rise in South American bean production & export." . Attached chart shows the corn and soybean March stocks trend found in USDA data for years 2005 through 2015. Soybean on-farm stocks for that period do show a strong statistical (high R squared) negative (down) trend for that period, as Richard observed.
 (MARCH on-farm stocks since 2005.png) (MARCH on-farm stocks since 2005.png)
Attachments
----------------
 MARCH on-farm stocks since 2005.png (76KB - 91 downloads) MARCH on-farm stocks since 2005.png (76KB - 91 downloads)
|


 March on-farm corn and soybean stocks (chart)