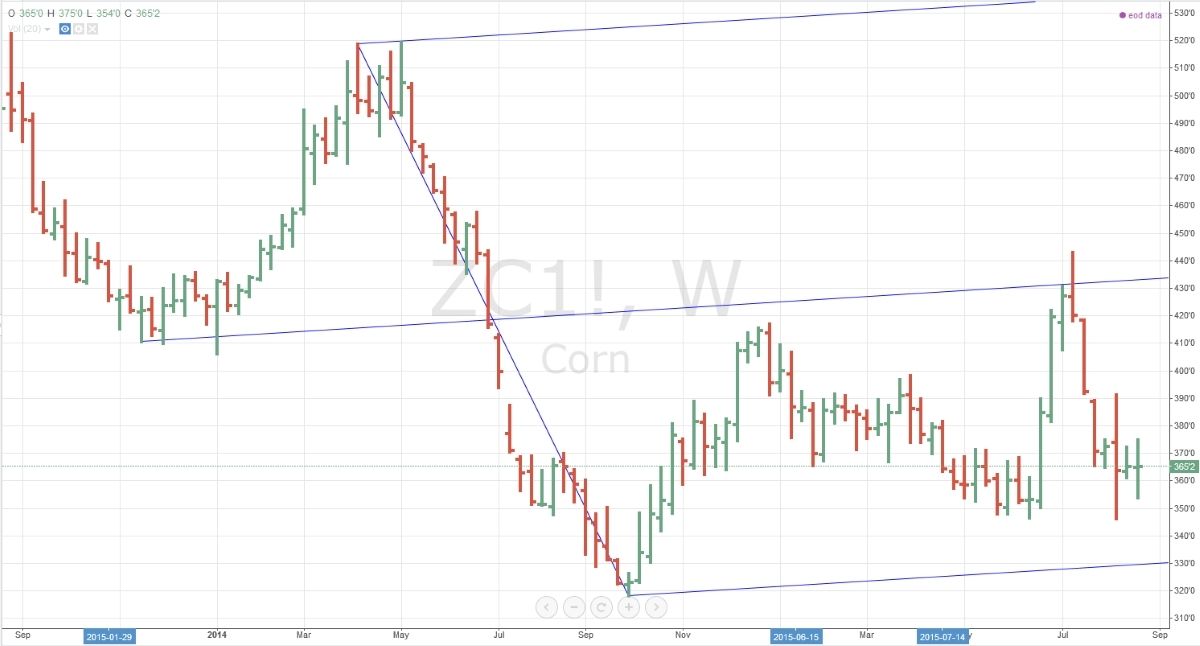
So some of us were waiting for corn to hit the ML of this fork for quite awhile late last year up until recently. 
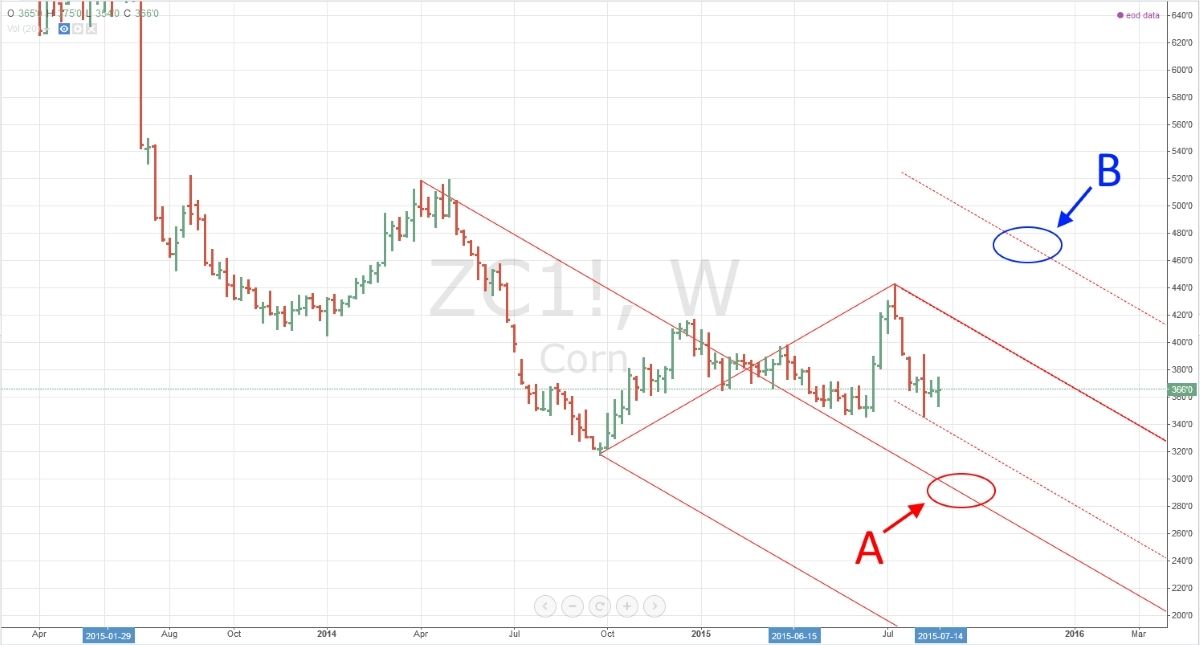
So when it hit, hopefully we were able to make the sales we needed to make. At this point, I'm trying to figure out what's next. The fork I've been looking at is below and I haven't seen anyone else mention it so I'm wondering what I'm doing wrong. I know there's more to it than drawing a fork, but in my mind, this one carries some weight and since no one has mentioned it I'm trying to figure out what I'm doing wrong: 
I guess I feel like there is a pretty good chance we're going to the A area below $3.00. However, there is also a chance that we hagopian to the B area or above. So what do the experts say on this? I guess realistically, pretty much the same targets have been mentioned by others and using different ways to get there so maybe it's just a different way of finding the path. | 

 Corn charts