Edit: If anyone stumbles upon this in the future, I think it's likely my understanding of market structure was not complete at this point. Please refer to this thread. With the rain I continue to find myself making some time for studying the markets. As usual, I should preface this by saying I am very new to all of this and you would be very unwise to make any decisions based upon what I post. I'm just using this board as a place to find people to tear my ideas apart, not as a place to recommend my ideas to others. As I look at Kansas City wheat, it appears to me that it is still solidly entrenched in a downtrend. This particular place seems like a very interesting place to me though, for reasons I'll explain in a minute. First though, why do I say we're in a downtrend? Aren't we at the peak of a recent $0.80 rally? The chart below will help resolve that question. 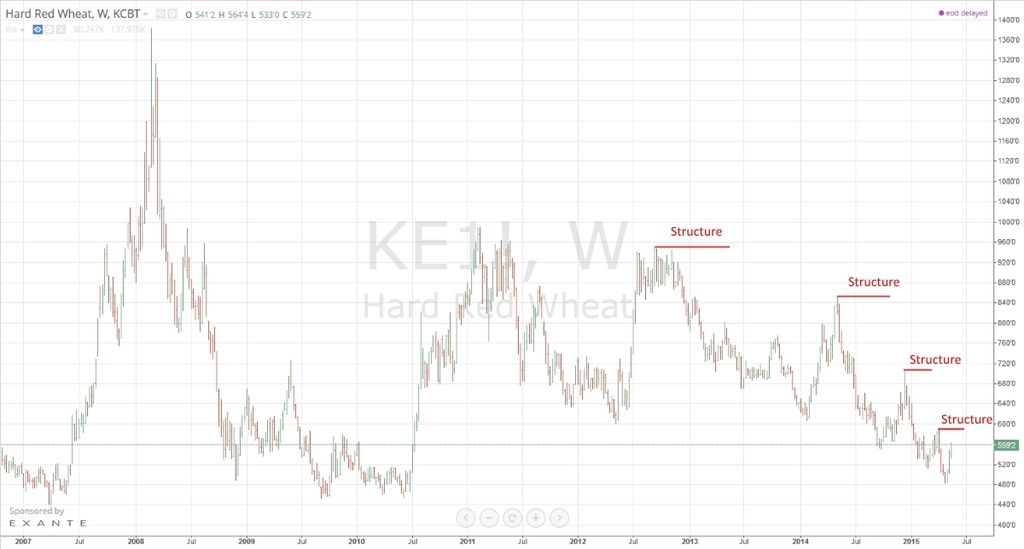
Each line above (maybe not the first one? jpartner or NoDakFarmer?) marked "structure" is a confirmation of sorts that we're in a downtrend. Each of those highs went on to make new lows and each of those highs was never breached again by a higher high. For us to exit the downtrend, one of those structural levels needs to be breached. Until that happens, we are in for another leg down, probably to new lows on this chart. The above chart was a weekly chart. The daily chart below is basically the same: 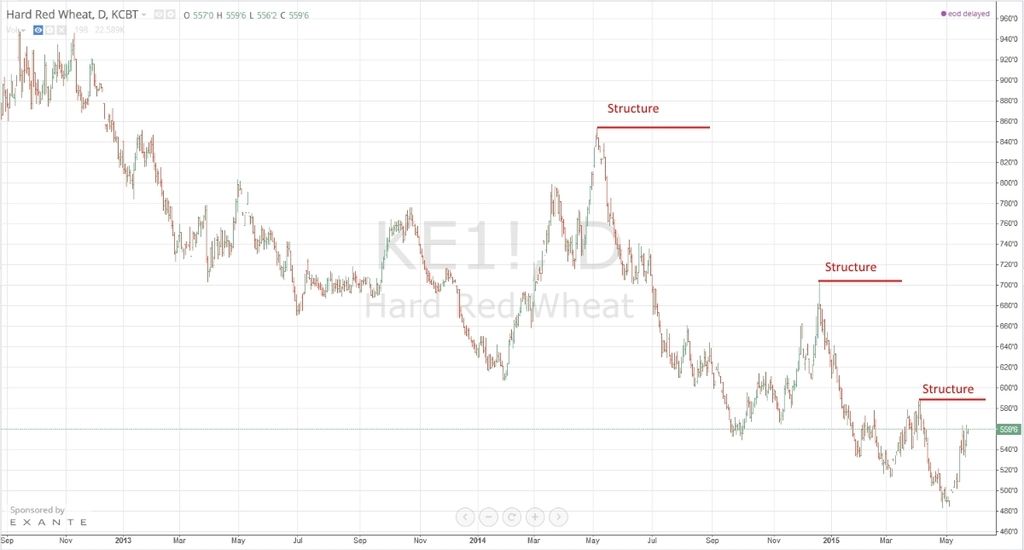
The following chart is a very busy chart because of my notes and is almost unrelated to everything I am saying in this post, but I find it fascinating nonetheless. The chart shows two forks. When price failed to reach the median line (ML) of the larger green fork, price came under the influence of the Hagopian Rule. The very fact that price was under the influence of the Hagopian Rule on the green fork almost assured us that price would not reach the ML of the blue fork either. So then both forks were under the influence of the Hagopian rule, and both Hagopians were fulfilled simultaneously. I didn't pick up on that until just a few minutes ago as I was preparing this post and I just found it fascinating how precisely the two Hagopians predicted the low in price. With jpartners help I saw the larger Hagopian before it was fulfilled but I only now noticed the smaller one. 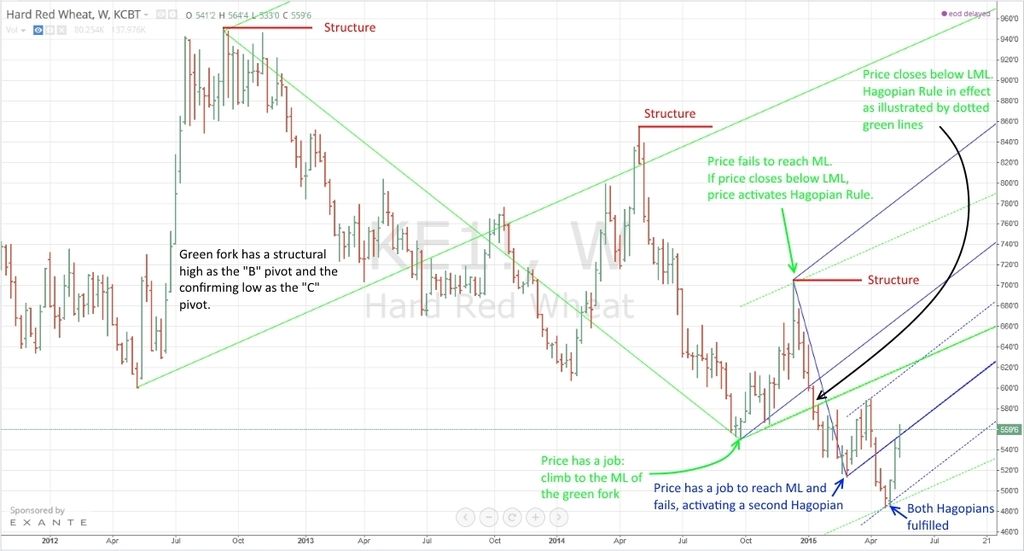
By meeting the obligations of the Hagopian rule, price ran out of downward energy which resulted in our recent rally. The question now is, "is this time different?" In my opinion, the answer is not clear, but I believe the answer to be no. Consider this final chart: 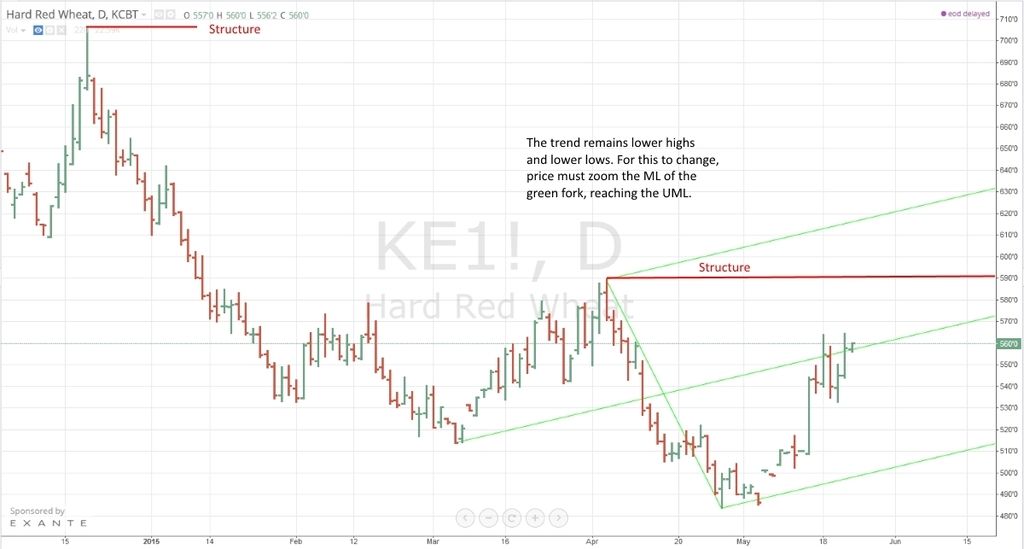
The above chart is a daily chart with one simple fork. As always, price has a job (go to the ML). In this instance it has accomplished it's objective. Now the question is, what does price need to do to make this time different, and is it doing that? I submit the answer is that price needs to not only reach the ML, it needs to zoom the ML and reach the UML. Doing so would mean price has gone higher than the last structural high. It would be a very significant event because it would mean something has CHANGED for the first time since 2008 on the Kansas City wheat chart. It would be a really big deal even though the swing is not as large as hardly any of the other swings we have observed since that time. As a farmer in NW Kansas, I can't tell you how happy that would make me, but the question is, does it look like that's what price is doing? To me, the price action the last couple of days is unfortunately, much more symptomatic of a bunch of small guys getting all excited about our little rally and trying to buy into it while someone else is calmly swallowing those orders up before saying "nope, not this time". Like I said, I really hope I'm wrong, I really hope it's time to turn this ship around, but so far I just don't see it. Earlier in this post I mentioned this is a very interesting place to me. Anyone notice what is different about this particular place than all of the others we have seen since 2008? We are very VERY close to a structural high right now. This means a guy can take a position and if that structural level is blown out, you can have stops placed slightly above it. Yes, you'll lose 20 cents or so trying to find out whether this time is different, but I believe there is a lot more downside risk if this time isn't different. Ordinarily as a hedger I would not consider lifting a hedge after entering a hedge unless price is significantly lower than the price at which I entered my hedge or I was offsetting the selling of the physical product. However, in this situation, I may very well be willing to risk the margin calls. As producers, the last time we had anywhere close to this kind of an opportunity to place well thought out stops that weren't going to cost us huge amounts of money if we were wrong was in September of 2010. At that time we could have risked $0.40 if we were wrong before our stops kicked in. This time around the risk is only $0.22 cents. Like I said at the beginning, I'm new to this. These are just my ideas and they will likely cost you dearly. If you make any decisions based upon my ideas, you own them, not me and I will feel no guilt for your decision. It's just something I'm considering and I am quite interested in others tearing my thoughts apart to make me better. Thanks.
Edited by dpilot83 5/26/2015 19:36
|  Kansas City Wheat charts again - still looks like a sell to me

