So here we are, having added 10% to the value of stocks from their Christmas Eve low when we listed a baker’s dozen reasons why stocks could tactically rally from there. We wrote further about the statistical merit to a rally after such an emotional selling panic here and here. Now the question is, after such a fast and furious rally that has retraced 65% of the waterfall decline from the December 2nd high in just 14 trading days, how much longer does this thing have to run before we experience some sort of pullback of at least 5%? Furthermore, under what kinds of conditions do uninterrupted 15% waterfall declines occur in the first place, and what does that portend for our current situation?
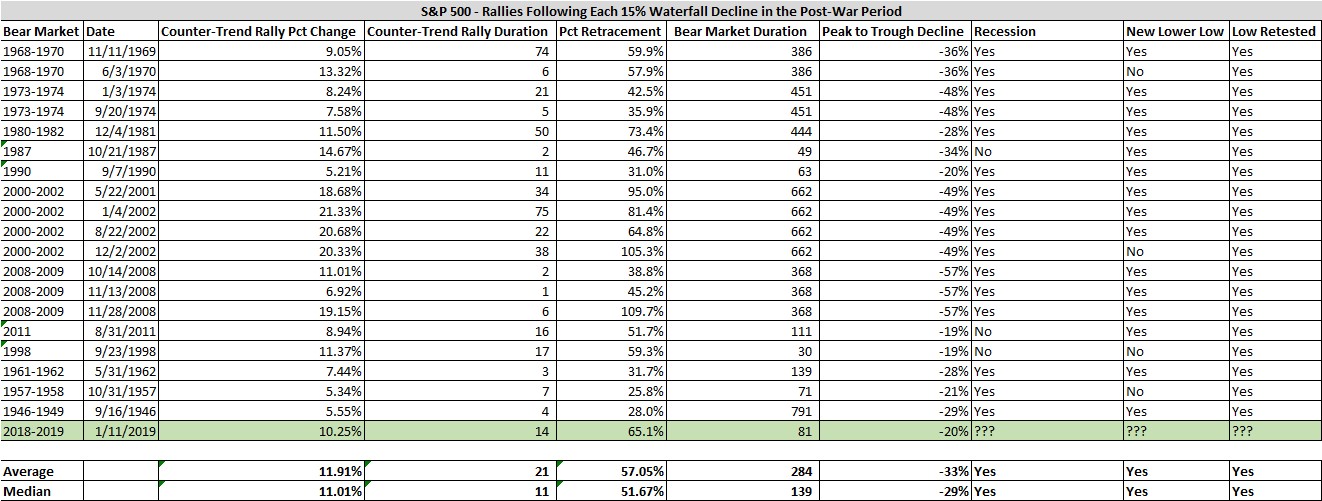
To answer those questions, we’ve cataloged all 20 uninterrupted 15% declines in the post-war period and documented what has happened afterward, as well as the type of market environment in which those declines have taken place. By uninterrupted decline, we mean a waterfall decline of at least 15% without an intermediate counter-trend rally of at least 5%. Some bullet points describing the rallies following those declines are below:
- The average counter-trend rally following a 15% waterfall decline is 11.9% (11% median) and it takes place over 21 trading days on average (median 11 days).
- The rallies end up retracing 57% of the decline on average (median 52%).
- Waterfall declines of at least 15% have only taken place in bear markets.
- The average of those bear markets have a peak-to-trough decline of 33% (median 29%)
- The duration of those bear markets is 284 trading days on average (median 139 days)
- In 16 of 19 instances (excluding the decline we just witnessed), a recession was associated with the bear market
- 100% of the time the low resulting from the waterfall decline was retested, and in 15 of 19 cases a new lower lower was made.
What do these data say about the current counter-trend rally?
- First, this rally has already retraced 65% of the waterfall decline (greater than average and median) and has lasted about three weeks (less than average but greater than median). This suggests upside from here may be limited in both magnitude and duration.
- Furthermore, these data strongly suggest the major index will retest the Christmas Eve low at the very least and most likely will make a new lower low in the weeks and months ahead.
- While we are not forecasting a recession at this time, waterfall declines of the magnitude just witnessed tend to take place in recessionary market environments, so we need to at least be open to that possibility.
- Finally, waterfall declines typically take place in bear markets lasting an average of 284 days (median 139 days). At just 81 days in duration, these data suggests we have bit further to run before we reach the bear market nadir. That said, there are four instances of waterfall declines taking place in short bear markets, so we don’t place much weight on this particular piece.
 Stock market jumping up! USA blinked first!

