
Centre county Pennsylvania, USA | Barchart provides very accurate, complete, and timely historical data for nearly all market trades. Some is provided in graphical images but most is provided in tables of numbers and strings. All (100%) of that data speaks to what has already happened, not to what will happen going forward in time. In other words, what lies ahead in time is anyone’s guess. No human has any ability to clearly see what lies ahead.
My interest in the barchart data is to convert barchart tables of numbers to graphical images. Some folks (including myself), are better able to ‘see’ what the data is telling us when the data is presented as graphical images.
FWIW, I’ve attached graphical images of today’s End-Of-Day CBOT grain futures market price changes and volumes. The images provide an accurate and reasonably complete ‘picture’ of today’s grain futures market price changes and volumes. They do not speak to what tomorrow’s market price changes and volumes will be.
 (Wheat futures, 04-24-2018 (full).jpeg) (Wheat futures, 04-24-2018 (full).jpeg)
 (Corn futures, 04-24-2018 (full).jpeg) (Corn futures, 04-24-2018 (full).jpeg)
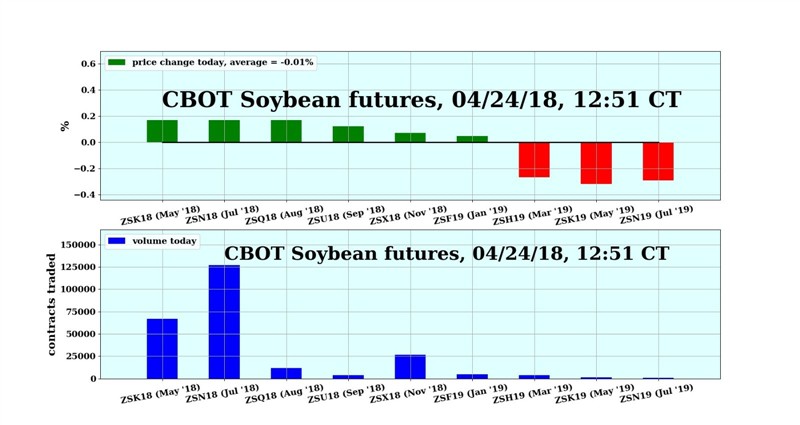 (Soybean futures, 04-24-2018 (full).jpeg) (Soybean futures, 04-24-2018 (full).jpeg)
Attachments
----------------
 Wheat futures, 04-24-2018 (full).jpeg (67KB - 71 downloads) Wheat futures, 04-24-2018 (full).jpeg (67KB - 71 downloads)
Corn futures, 04-24-2018 (full).jpeg (67KB - 71 downloads)
Soybean futures, 04-24-2018 (full).jpeg (67KB - 69 downloads)
|
 CBOT Grain Futures, 04/24/18. 12:48 CT update

