
Centre county Pennsylvania, USA | Combines here in HEL land almost always run with high pitch and roll dynamics as illustrated in the attached combine attitude map. That map used only first differences of GPS fix data logged by the combine while harvesting and clearly shows both on-track and cross-track patterns that correspond to terrain features. Because the combine attitude map used no yield data, and no delay, it should give a true representation of terrain "Bumps" as seen by the moving combine. The 2nd map is an imaged yield map for that same dataset, it used all GPS fix, mass flow, and moisture data logged by the combine while harvesting that bean field. The dark areas inside that field shown in the imaged yield map are wildlife damage areas
This pair of maps is very representative of the maps we produce for most of our bean and corn fields every year. I'm still not clear on what those map pairs are trying to say, but I do have some opines:
(1) Modern yield sensors appear to be well compensated for combine attitude, including terrain "bumps".
(2) Wildlife has the greatest effect on our yield maps, followed by soil water capacity. Fertility, variety, weed and insect control are NOT yield drivers here.
(3) Yield maps seem to be of limited value here, but we haven't given up, yet.
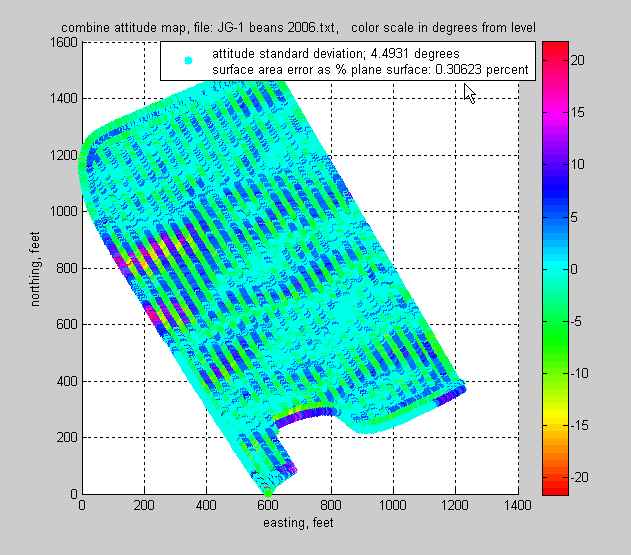 (JG-1 combine attitude map 2006.jpg) (JG-1 combine attitude map 2006.jpg)
 (JG-1 bean yield map 2006.jpg) (JG-1 bean yield map 2006.jpg)
Attachments
----------------
 JG-1 combine attitude map 2006.jpg (48KB - 242 downloads) JG-1 combine attitude map 2006.jpg (48KB - 242 downloads)
JG-1 bean yield map 2006.jpg (35KB - 265 downloads)
|
 Something for Everyone to Shoot Holes IN !! Moved From Crop Talk.

