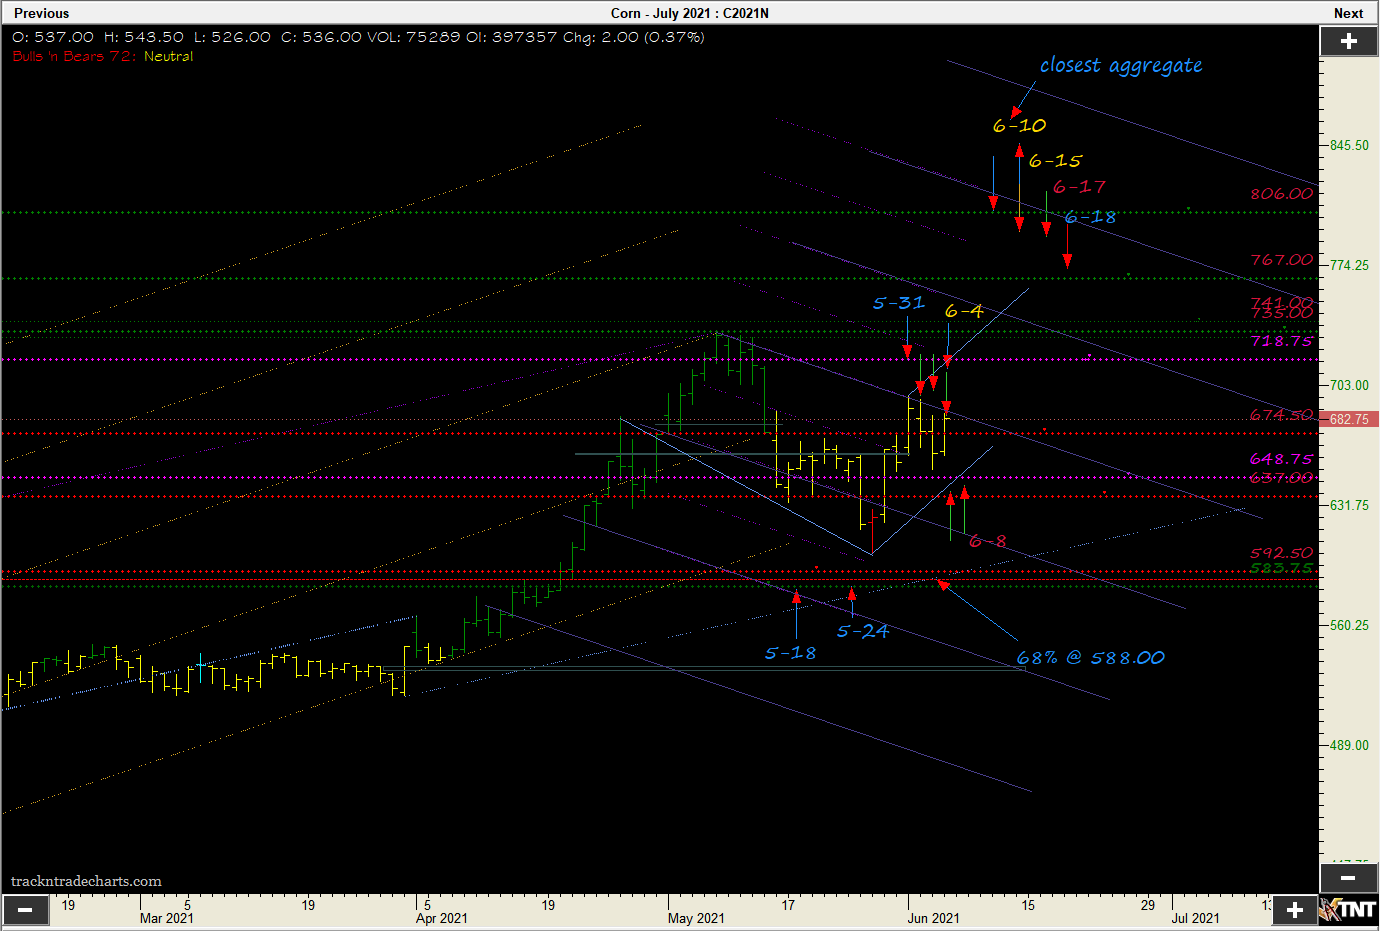
| Price and Time on the daily.
Price are the Reversals, green Bullish, red Bearish...magenta is intraday crash and breakout resistance...
Time is the Aggregate Peaks and troughs, blue and red....green are the Directional changes...which could be in the same direction...yellow are the Panic cycles.
Trading cycles are the dates...Red = ideal time for a cycle low...measured from a high, Green = deal time for a cycle high measured from a low, Yellow = both cycle low and a cycle high that converge on the same day. Main idea is to watch for change of trend or a continuation of one...on the time at the price.
Sp!ke
Edited by Spikes 6/7/2021 01:29
|
 July Corn

