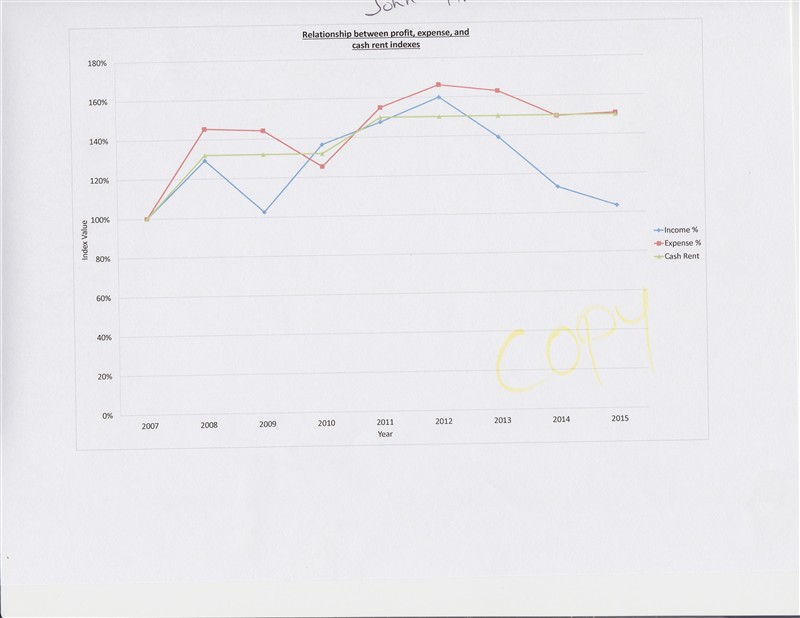
Doing some work to have a discussion about lowered cash rents on several farms. I used an average of Rain and Hail's projected and harvest prices for each year for the income line. The expense line is a NAAS average of fertilizer and my actual seed cost per unit. It doesn't take anything else into consideration except fertilizer and seed, my two largest expenses. The third line is cash rent paid on individual farms. I used 2007 as a base line where everything was at 100%. Basically saying our income and expenses were in balance (right or wrong). So expenses, income and cash rent went up pretty much at the same pace until 2012 when income started to slide. Currently we are at 2007 income prices almost exactly but expenses remain at 150% of 2007.
 (chart of income expenses and cash rent.jpg) (chart of income expenses and cash rent.jpg)
Attachments
----------------
 chart of income expenses and cash rent.jpg (50KB - 263 downloads) chart of income expenses and cash rent.jpg (50KB - 263 downloads)
|  chart of relationship between revenue, expenses and cash rent

