| Okay Sat.. pull your money flow data out.. The bounce higher yesterday is being blamed on a couple of things.. the unexpected 5.5 myn bbl drawdown on stocks reported Wednesday (by moi no less..) Nigeria acting up again.. and SHORTS.. running for cover.
Reportedly we have NEAR RECORD shorts in Crude.. ( http://www.cnbc.com/2015/08/26/oil-prices-rise-on-crude-stock-draw-... )
Since July, as oil prices embarked on a second steep decline, big funds and speculators nearly trebled their gross short positions in U.S. crude oil futures and options to more than 160 million barrels, just short of a record 180 million barrels in March, according to regulatory data. Dealers have been bracing for that to unwind, with some warning that the scramble to exit those trades could be fierce. "It's the squeeze on short-sellers that we've been anticipating after the oil markets saw panic selling and capitulation trade in the $30 levels," said Chris Jarvis, analyst at Caprock Risk Management in Frederick, Maryland. "Couple this with strong continued demand for gasoline and solid GDP numbers out of the U.S., and China's actions to reinflate their economy with a very shorted market, the near-term bounce we have been calling for appears to be working out." U.S. nationwide crude oil stocks unexpectedly fell by more than 5 million barrels last week, and data from industry group Genscape showed that inventories in Cushing, Oklahoma, declined by another nearly 400,000 barrels since last Friday. Even so, most analysts were pessimistic that oil could maintain its trek higher. Granted.. most remain bearish.. And it is difficult to see much of a recovery going into the Northern Hemisphere offseason for motor fuel demand.. Most analyst do look for a strong demand to re emerge by Q2 2016.. with numbers around $60 to $70 being tossed out there.. "could be."
Can Bears regain control of the Crude Market to squeeze a few more $$$ out of longs?
Probably would have to look at the value of the dollar.. as it has been nearly 100% negatively correlated with Crude over the summer.. Dollar up.. Crude down.. However, the financial turmoil has shown some cracks in the Dollar to the Moon trade.. with a SHARP selloff on Monday.. to NEAR the lowest levels of the year.. currently we are retesting the uptrend.. however, IF the dollar DOES NOT re establish it's uptrend... we could go back down to test out the 80'ish level on the dollar index...which would provide a nice tail wind for all commodities..
So there's that..
Another "out there" "conspiricy theory of the day.." would be that Crude Oil was a bubble that needed to be popped by Fed policy..
( http://www.realclearenergy.org/articles/2015/08/28/did_the_fed_intentionally_force_an_oil_sell-off_108718.html ) One theory is that some within the Fed realized that QE wasn’t working, and never worked, thus another path was needed. But what alternative did they have, since rates were already ZERO? So maybe they changed course and took a strong dollar policy vs. a weak one to intentionally weaken the commodity sector and thus boost consumer spending. Throughout this down turn, that message has been repeated by Yellen herself many times, as a source of economic stimulus and for sure has been repeated over and over in the media and the talking heads of Wall Street. Wall Street is notorious for not fighting Fed policy, so they turned to other asset classes such as technology to blow that bubble up even further. But then why was there such a desire to close the Iran deal so suddenly, which would further add to global oil supply? This theory isn’t as farfetched as it initially seems, especially considering that Wall Street has been investing based on central bank policies for 6 years now, moving money where easing occurs around the globe and putting very little into real fundamentals. It’s something to consider in explaining prices.
(I believe Tara wrote this article.. ;-)
Fundamentally.. I have argued that US statistics are behind the curve.. (especially the Tight Shale depletion curve..) on recognizing US production declines as a response to the collapse in Crude prices coming up this November.. Some of the data.. is now starting to colloborate my theory.. as rail shipping and stocks have come in LOWER than they should for the expected supply that we are supposed to be cranking out.
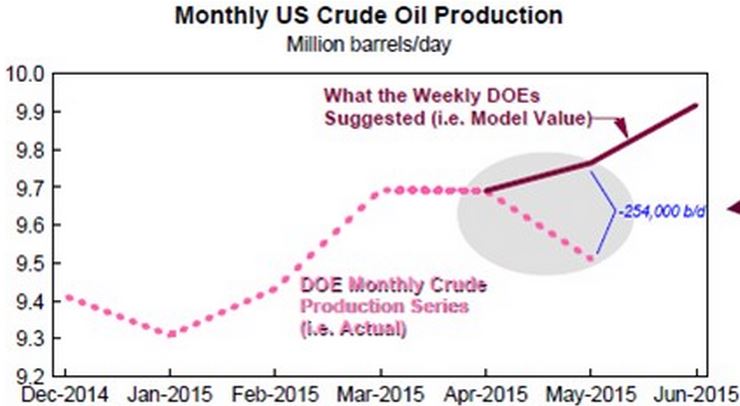
Right now the EIA Monthly reported data for March is HIGHER than the Weekly Data shows..
Here is the monthly data.. http://www.eia.gov/dnav/pet/hist/LeafHandler.ashx?n=pet&s=mcrfpus2&f=m | U.S. Field Production of Crude Oil (Thousand Barrels per Day) | | |
| Year | Jan | Feb | Mar | Apr | May | Jun | Jul | Aug | Sep | Oct | Nov | Dec |
|---|
| 2014 | 8,018 | 8,133 | 8,262 | 8,544 | 8,612 | 8,671 | 8,749 | 8,836 | 8,958 | 9,135 | 9,203 | 9,413 | | | | 2015 | 9,309 | 9,432 | 9,693 | 9,691 | 9,511 | | |
| Weekly U.S. Field Production of Crude Oil (Thousand Barrels per Day) | | |
| Year-Month | Week 1 | Week 2 | Week 3 | Week 4 | Week 5 |
|---|
| End Date | Value | End Date | Value | End Date | Value | End Date | Value | End Date | Value |
|---|
| 2015-Jan | 01/02 | 9,132 | 01/09 | 9,192 | 01/16 | 9,186 | 01/23 | 9,213 | 01/30 | 9,177 | | 2015-Feb | 02/06 | 9,226 | 02/13 | 9,280 | 02/20 | 9,285 | 02/27 | 9,324 | | | | 2015-Mar | 03/06 | 9,366 | 03/13 | 9,419 | 03/20 | 9,422 | 03/27 | 9,386 | | | | 2015-Apr | 04/03 | 9,404 | 04/10 | 9,384 | 04/17 | 9,366 | 04/24 | 9,373 | | | | 2015-May | 05/01 | 9,369 | 05/08 | 9,374 | 05/15 | 9,262 | 05/22 | 9,566 | 05/29 | 9,586 | | 2015-Jun | 06/05 | 9,610 | 06/12 | 9,589 | 06/19 | 9,604 | 06/26 | 9,595 | | | | 2015-Jul | 07/03 | 9,604 | 07/10 | 9,562 | 07/17 | 9,558 | 07/24 | 9,413 | 07/31 | 9,465 | | 2015-Aug | 08/07 | 9,395 | 08/14 | 9,348 | 08/21 | 9,337
|
How can EIA show March at 9,693 bbls per day on the Monthly data when the weekly data does not have ONE SINGLE DATA POINT at or Above that level? As the highest is 9,422 bbls per day on 3/20..
The Weekly shows the peak as 9,610 k bbls per day the week of 6/5.. while the latest number is about 300 k bbls per day lower at 9,337.. Given that we have parked about 1,000 drilling rigs over the past year.. could we see US production drift lower back below 9,000 bbls per day this winter? I would guess "yes."
Edit add: I need to remind myself that these are TWO DIFFERENT data sets.. so there could be a 300 k bbl slap in the accounting.. HOWEVER, those that I have read/follow CONTEND that the numbers ARE overstated.. not unlike a Crop Production number.. where we find out later that 300 myn bushels went "poof" Gov't accounting is the BEST there is.. but NOT Bulletproof.. which is my point.. They have OVERSHOT the High water mark.. "it happens."
Couple this with all the chatter in OPEC about curtailing production.. as well as.. well.. we don't even know if the IRAN deal is going to get approved.. and even if it does.. Will that be allowed to stand? aka What will Isreal's response be?
So I believe the whole Iran pumping crude onto the world market is overblown.. as well as the Chinese fire drill.. sell off..
We may not be AT the bottom.. (although we could..) but we're probably close.. maybe one more spike down to $35'ish.. or on another financial sell off to the 09 lows..
but watch the dollar.. if that uptrend does not resume.. it's probably "game on" for higher crude prices
IMHO.. and of course.. "I could be wrong."
*** NOT a SOLICITATION to Trade.. people can AND DO lose $$$ trading... (boy howdie.) ***
Cheers.
Edited by JonSCKs 8/28/2015 09:36
|
 Near Record Crude Shorts running for cover..???

