| Oh Contraire: Why do you think Stocks DECLINED so much? 5.5 myn bbls is HUGE!! We get another update next week but according to the monthly statistics: US Crude Oil production is declining. Here is the monthly data.. http://www.eia.gov/dnav/pet/hist/LeafHandler.ashx?n=pet&s=mcrfpus2&f=m | U.S. Field Production of Crude Oil (Thousand Barrels per Day) | | |
| Year | Jan | Feb | Mar | Apr | May | Jun | Jul | Aug | Sep | Oct | Nov | Dec |
|---|
| Year | Jan | Feb | Mar | Apr | May | Jun | Jul | Aug | Sep | Oct | Nov | Dec |
|---|
| 2014 | 8,018 | 8,133 | 8,262 | 8,544 | 8,612 | 8,671 | 8,749 | 8,836 | 8,958 | 9,135 | 9,203 | 9,413 | | | | 2015 | 9,309 | 9,432 | 9,693 | 9,691 | 9,511 | | | | | | | |
March was the highest.. with May falling 182 k bbls per day below that peak... thus far. Here is the weekly data.. http://www.eia.gov/dnav/pet/hist/LeafHandler.ashx?n=pet&s=wcrfpus2&f=w | Weekly U.S. Field Production of Crude Oil (Thousand Barrels per Day) | | |
| Year-Month | Week 1 | Week 2 | Week 3 | Week 4 | Week 5 |
|---|
| End Date | Value | End Date | Value | End Date | Value | End Date | Value | End Date | Value |
|---|
| Year-Month | Week 1 | Week 2 | Week 3 | Week 4 | Week 5 |
|---|
| End Date | Value | End Date | Value | End Date | Value | End Date | Value | End Date | Value |
|---|
2015-May | 05/01 | 9,369 | 05/08 | 9,374 | 05/15 | 9,262 | 05/22 | 9,566 | 05/29 | 9,586 | | 2015-Jun | 06/05 | 9,610 | 06/12 | 9,589 | 06/19 | 9,604 | 06/26 | 9,595 | | | | 2015-Jul | 07/03 | 9,604 | 07/10 | 9,562 | 07/17 | 9,558 | 07/24 | 9,413 | 07/31 | 9,465 | | 2015-Aug | 08/07 | 9,395 | 08/14 | 9,348 | 08/21 | 9,337 |
9,610 is the high (thus far..) with last week's number 273 k bbls below that.. oh and prices are lower now reducing the ABILITY to drill.. as production companies are fighting for their financial lives. Speifically looking at the shale oil production.. North Dakota (thus far..) peaked last December at 1.129 myn bbls per day.. https://www.dmr.nd.gov/oilgas/stats/historicalbakkenoilstats.pdf with 8,946 wells kicking out an average of 130 bbls per well.. that per well average continues to fall from it's peak at 145 bbls per day back in June of 2010.. to 116 bbls per day per well as of June this summer.. The addition of new wells is slowing while the other 9.000 wells continue to advance through their depletion curves.. simple math tells you that in order to maintain 1.129 myn bbls per day.. at 10,000 wells will take an average of 112.9 bbls per well per day.. IF 9800 age down the curve.. those 200 additional wells have to really be special.. Given that the wellhead price is below the cost of drilling.. it is doubtful that they can continue to add new wells to the mix... Even the EIA now shows a decline.. 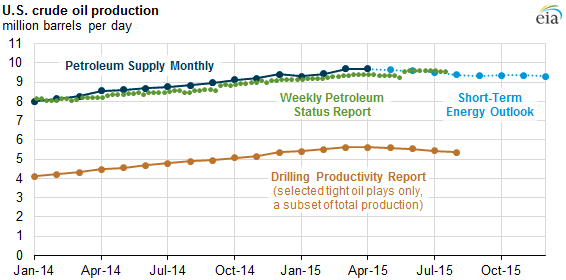
http://www.eia.gov/todayinenergy/detail.cfm?id=22292&src=email All of the US Shale Crude fields are now in decline except for the Eagle Ford (or is it the Permian? I'd have to do some digging..) but it's Cheaper to get Crude to a refinery in Texas than North Dakota.. the Bakken is hosed at these price levels.. And Oil Trains are gonna become Cheaper to find.. or parked. Have a Good Day Tara.
Edited by JonSCKs 8/26/2015 12:59
|
 Petroleum stocks down 5.5 myn bbls..

