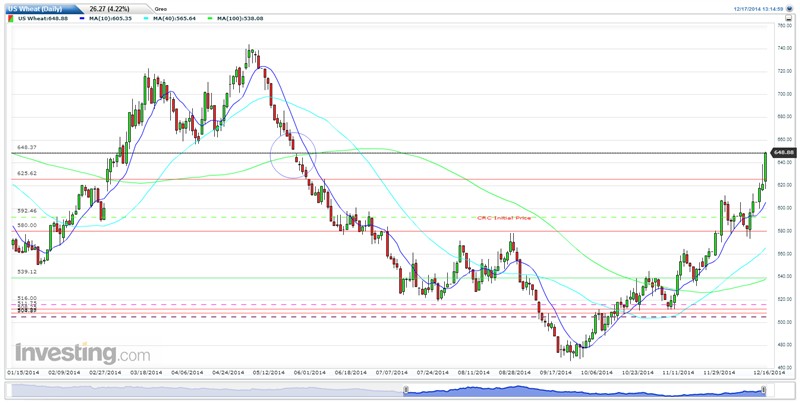
West-Central Missouri | Just Looking at a chart for chi wheat using continuous front month and just wondering where overhead resistance is at this point. i notice we closed today about 6.48/4 on March which comes pretty close to 5/22 close to 5/26 open gap that I have circled in blue. (if my chart reads correctly. because sometimes it will not) .
I reall don't know how to get image any bigger, but I think you can see what i mean. Also the other lines across don't mean anything.
http://www.investing.com/commodities/us-wheat-advanced-chart
Edited by gbryce 12/17/2014 15:51
 (Wheat Resistance.png) (Wheat Resistance.png)
Attachments
----------------
 Wheat Resistance.png (74KB - 127 downloads) Wheat Resistance.png (74KB - 127 downloads)
|
 Chi March Wheat Resistance

