Sometimes it helps to look at things in a completely different perspective... maybe you are trying to decide what percent of corn acres vs soybeans you will plant next year... maybe you are discouraged with soybeans performance and maybe your like me and you just want to make money to support your farming habit and keep your wife from thinking you lose more money than you make... in that case you would move your purchasing power from one market to the next depending on which market you believe will head higher... and not just higher but which will make you more % of gain in the same amount of time...
looking at these charts is like looking at a room from a different doorway... the dollar does not matter in these charts... we are comparing commodities to commodities...
Enjoy.
 (corn soy.png) (corn soy.png)
 (cornsoy.png) (cornsoy.png)
 (Gold corn.png) (Gold corn.png)
 (corngold.png) (corngold.png)
 (silver corn.png) (silver corn.png)
 (cornsilver.png) (cornsilver.png)
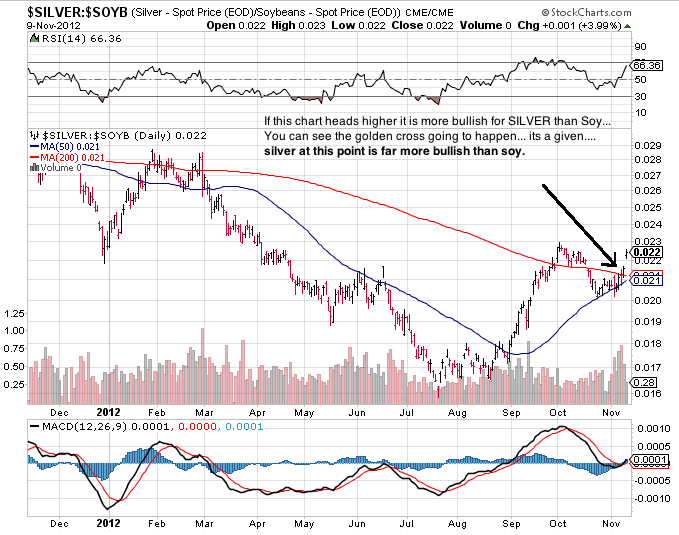 (silver soy.png) (silver soy.png)
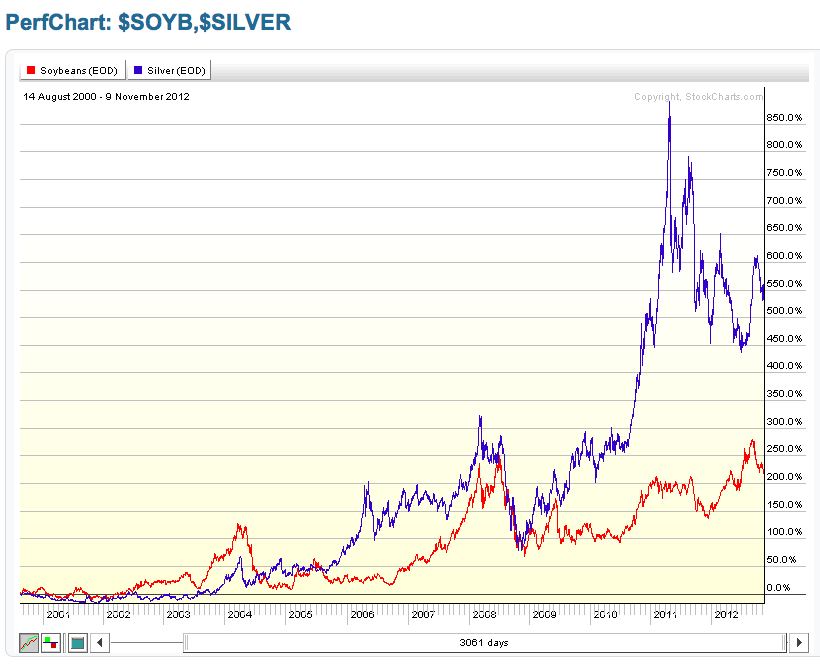 (soysilver.png) (soysilver.png)
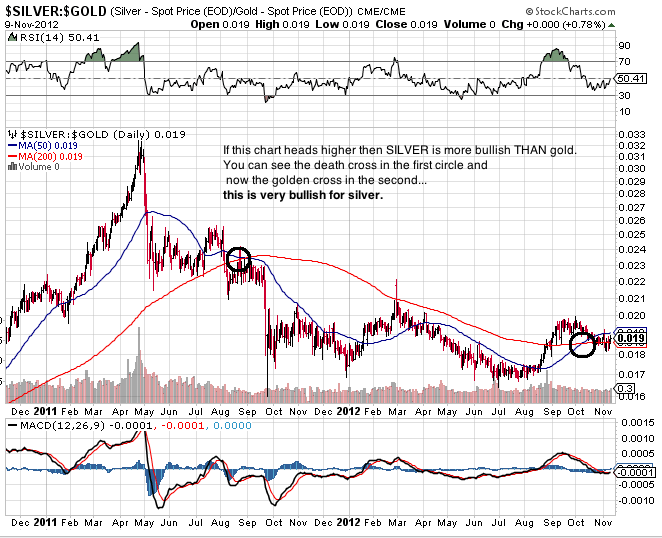 (silver gold.png) (silver gold.png)
 (goldsilver.png) (goldsilver.png)
Attachments
----------------
 corn soy.png (82KB - 226 downloads) corn soy.png (82KB - 226 downloads)
cornsoy.png (44KB - 212 downloads)
Gold corn.png (80KB - 189 downloads)
corngold.png (35KB - 194 downloads)
silver corn.png (76KB - 214 downloads)
cornsilver.png (36KB - 215 downloads)
silver soy.png (67KB - 212 downloads)
soysilver.png (37KB - 216 downloads)
silver gold.png (73KB - 199 downloads)
goldsilver.png (36KB - 202 downloads)
|  Change your perspective... Corn, Soybeans.... CHARTS

